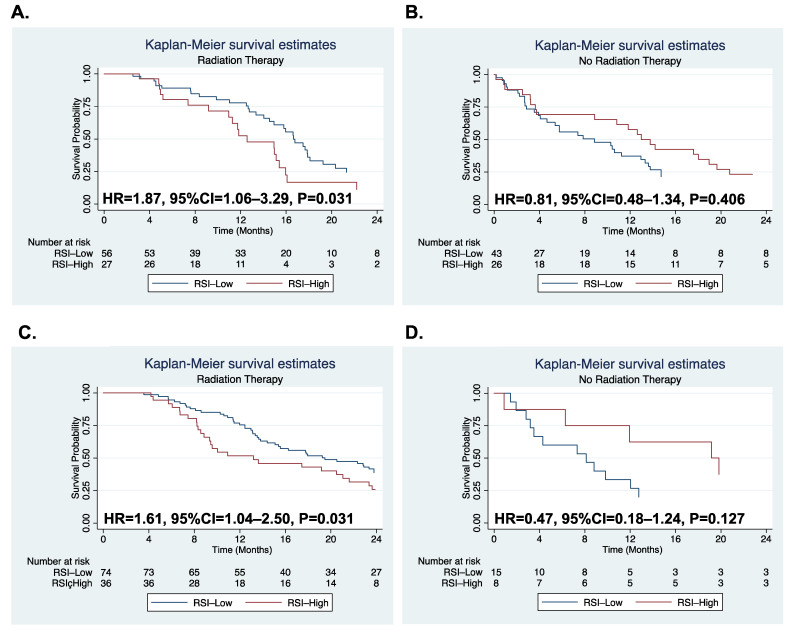
Figure 1.
In TCGA glioblastoma population, Kaplan–Meier curves are compared between RSI-high and RSI-low groups for patients who received radiation therapy (A) and did not receive it (B). In CCGA glioblastoma population, Kaplan–Meier curves are compared between RSI-high and RSI-low groups for patients who received radiation therapy (C) and did not receive it (D). p-value was estimated by Cox proportional hazard model. Abbreviations: HR, hazard ratio; CI, confidence interval; RSI, radiosensitive index; TCGA, The Cancer Genome Atlas, CGGA, The Chinese Glioma Genome Atlas.

