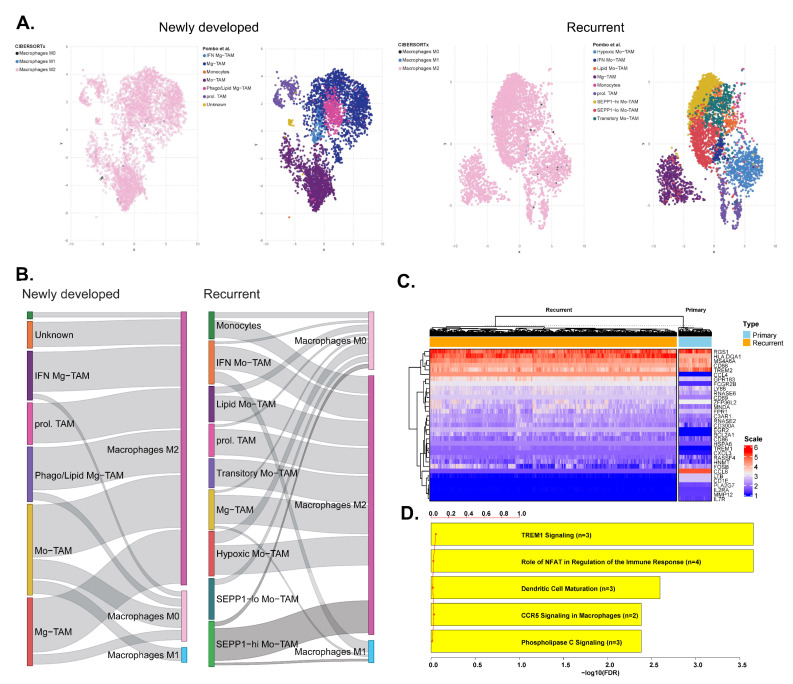
Figure 3.
From the brain immune atlas dataset, immune cells classified by CIBERSORTx and those reported by Pombo et al. [24] are compared for newly developed and recurrent glioblastoma in scatter plots (A) and a Sankey diagrams (B). (C) Heatmap showing macrophage gene expression patterns between primary and recurrent glioblastoma from the brain immune atlas dataset. (D) Gene set enrichment analysis for differential genes of macrophage between primary and recurrent glioblastoma. Abbreviations: TAM, tumor-associated macrophage; FDR, false discovery rate.

