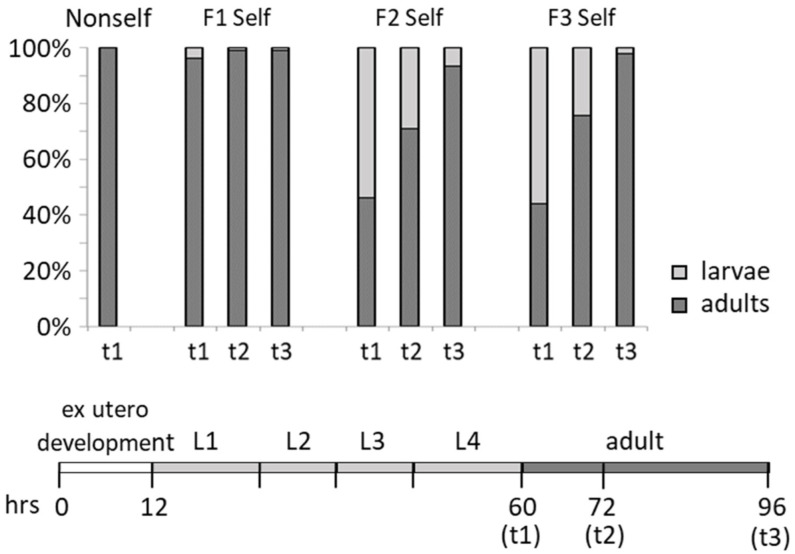
Figure 3.
Developmental delay of F2 and F3 worms fed on the self library. Quantification of the developmental delay phenotype of F2 and F3 larvae fed self compared to larvae fed non-self. Adults were counted at each time point (hours after egg-laying, x-axis), and percentages of adult worms (black) and larvae (grey) were calculated. Hours required to reach each stage in wt worms fed on non-self-bacteria library and hours corresponding to t1, t2 and t3 time points are illustrated on the bar below the graph. Number of worms scored: 307 Non-self; 234 F1 Self; 625 F2 Self; 549 F3 Self.

