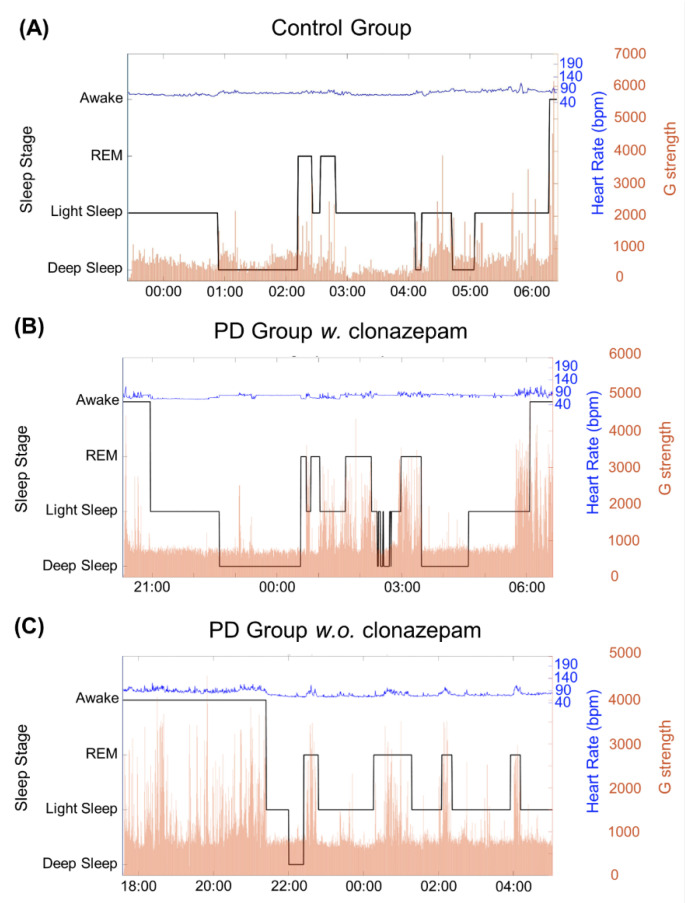
Figure 5.
Results of the three sleep-stage detection algorithm for the (A) control group, (B) PD group w. clonazepam, and (C) PD group w.o. clonazepam. The solid, black line represents the G-value, which was used to identify the three sleep stages. It revealed that the PD groups had longer awake and light sleep durations than those of the control group. In addition, the duration of the deep stage in the PD groups was less than that in the control group. The blue line represents the heart rate (bpm), which is correlated to the sleep stages. Variable heart rates were observed for the PD groups, particularly in the REM stage.

