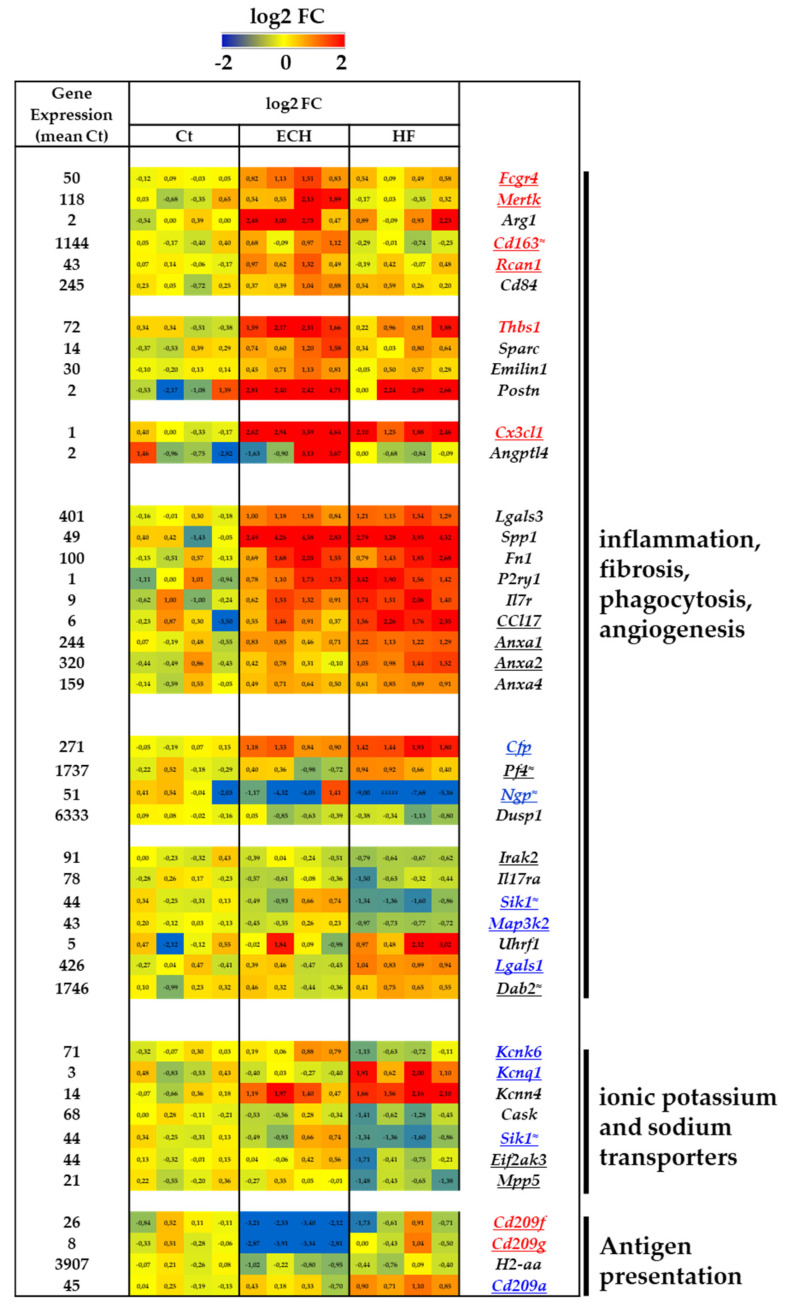
Figure 4.
Transcriptomic characterization of inflammation, fibrosis, phagocytosis, angiogenesis, and Ab presentation related genes in Ct, ECH, and HF cardiac CD64+ macrophages. Analysis of mRNA levels in isolated cardiac CD64+ cells by RNAseq (n = 4 mice/group, normalization and differential statistical analysis were performed with the glm edgeR package, with genes selectively and significantly regulated in the ECH group (written in red) as compared to Ct and HF and significantly regulated in HF group (written in blue) as compared to Ct and ECH. Genes written in black are compared to Ct and genes underlined display statistical different expression between ECH and HF groups (p < 0.05 Mann–Whitney test or addition of the symbol ≈ means p = 0.05 HF vs. ECH). (Left column). Indication of the mean value of gene expression in Ct macrophages (expressed in counts per million mapped reads (cpm) estimates). (Middle columns). Heat map representation of log2 fold change. (Right column). Significantly regulated genes.

