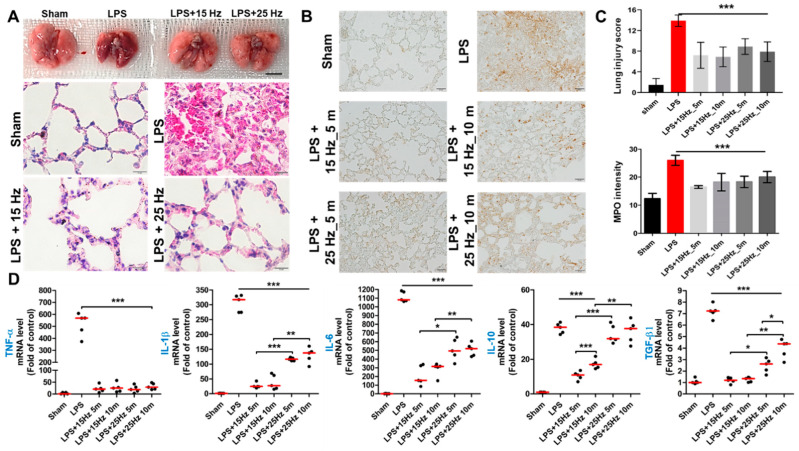
Figure 4.
Anti-inflammatory effect of taVNS on the lung of LPS-induced endotoxemia. (A) The representative images of the lung after treatment of taVNS with 15 Hz and 25 Hz. Scale bar: 5 mm. The results of H&E staining were determined using the lung injury score upon observation under a light microscope. Scale bar: 10 μm. (B) MPO staining was determined by the infiltrated immune cells on the lung. Scale bar: 20 μm. (C) The relative scoring of lung injuries was compared as a graph in three independent images. Positively stained area was measured in three different images in each group and then represented on a graph. (D) The expression levels of pro- and anti-inflammatory cytokines genes were determined by qPCR, and significance was compared among groups. Data have been presented as the means and standard deviation (n = 5–10); * p < 0.05, ** p < 0.01, and *** p < 0.001, as compared to the corresponding control.

