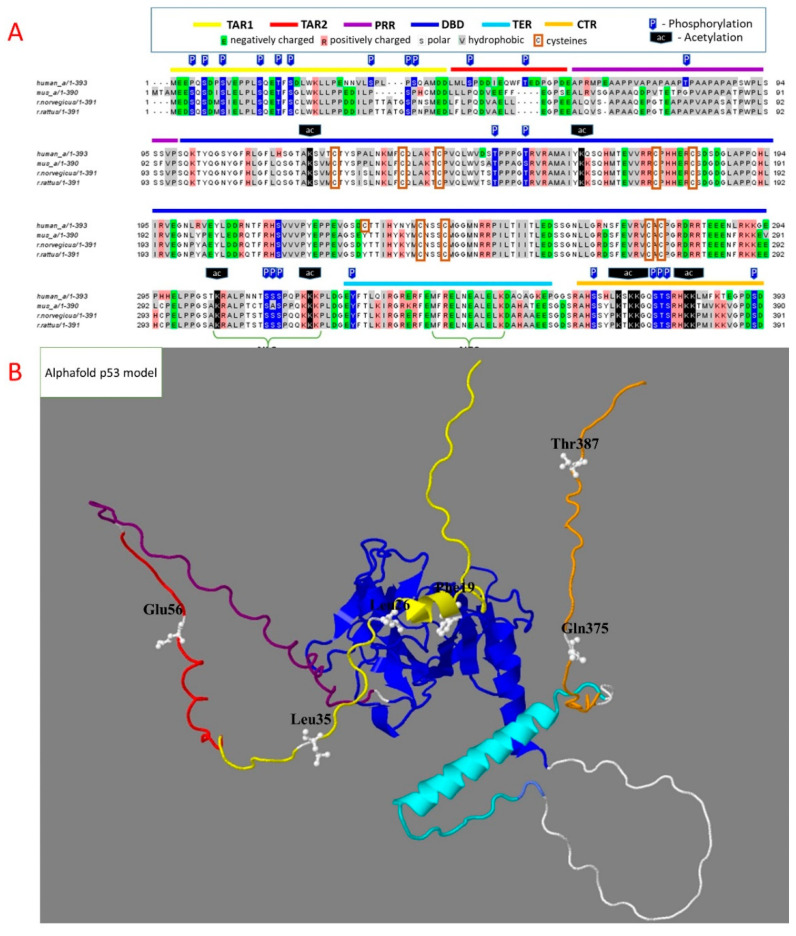
Figure 1.
Structural determinants of p53 homo- and heterologous protein complexes. Throughout this and other figures, specific regions are highlighted by color: yellow—transactivation region 1 (TAR1), red—transactivation region 2 (TAR2), purple—proline-rich region (PRR), blue—DNA-binding domain (DBD), cyan—tetramerization region (TER), orange—C-terminal region (CTR). (A)—Sequence of human p53 is aligned to that of model organisms, mouse and rat. Acetylation and phosphorylation sites with more than five references, according to the Phosphosite database, are marked as P (blue arrows) and Ac (black arrows) above the sequences. The cysteine residues are framed. (B)—The 3D model of full-length p53 structure, predicted by AlphaFold (https://alphafold.ebi.ac.uk/entry/P04637, accessed on 6 January 2022). The marked residues define the regions acquiring secondary structure in heterologous protein complexes.

