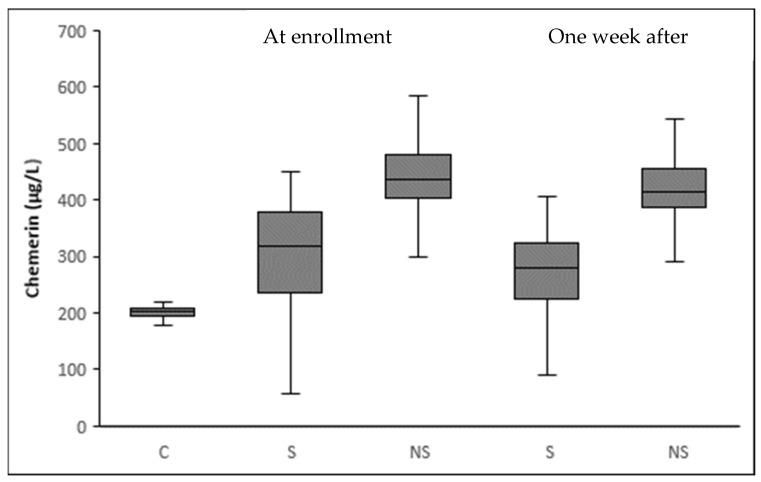
Figure 5.
Box plots of circulating chemerin at enrollment and one week after stratifying by 28-day mortality status. At enrollment, septic patients present a significantly higher mean level of chemerin (342.3 ± 108.1 μg/L vs. 200.8 ± 40.1 μg/L, p < 0.001) than controls (C). Circulating levels of chemerin are significantly higher in nonsurvivors (NS) than survivors (S) septic patients both at enrollment (427.2 ± 96.7 μg/L vs. 306.9 ± 92.1 μg/L, p < 0.001) and one week after (414.1 ± 94.5 μg/L vs. 264.2 ± 79.9 μg/L, p < 0.001). Additionally, the decrease in serum chemerin one week after enrollment is significant in both groups of patients (p < 0.001 for both S and NS). Finally, the mean difference between serum chemerin at enrollment and one week after is higher in S than NS (42.7 ± 22.2 μg/L vs. 13.2 ± 11.3 μg/L, p < 0.001).

