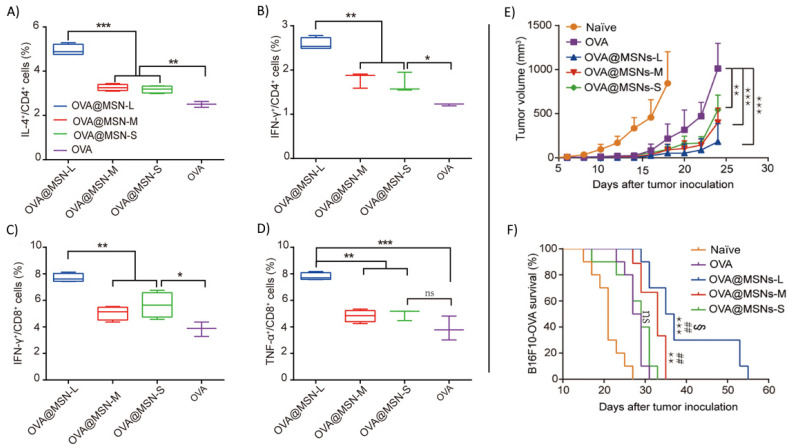
Figure 7.
Small MSN of varying pore size loaded with OVA antigen. (A,B) Percentage of CD4+ T cells producing IL-4 and IFN-γ. (C,D) Percentage of CD8+ T cells producing IFN-γ and TNF-α. (E) Tumor growth curve of B16F10 cells. (F) Kaplan-Meier survival curve of mice comparing naïve, free OVA, and OVA@MSN. Error bars, mean ± s.d., * p < 0.05, ** p < 0.01, *** p < 0.001 versus free OVA; ## p < 0.01 versus OVA@MSNs-S; § p < 0.05 versus OVA@MSNs-M. Reprinted (adapted) with permission from Ref. [130]. Copyright 2021, Science.

