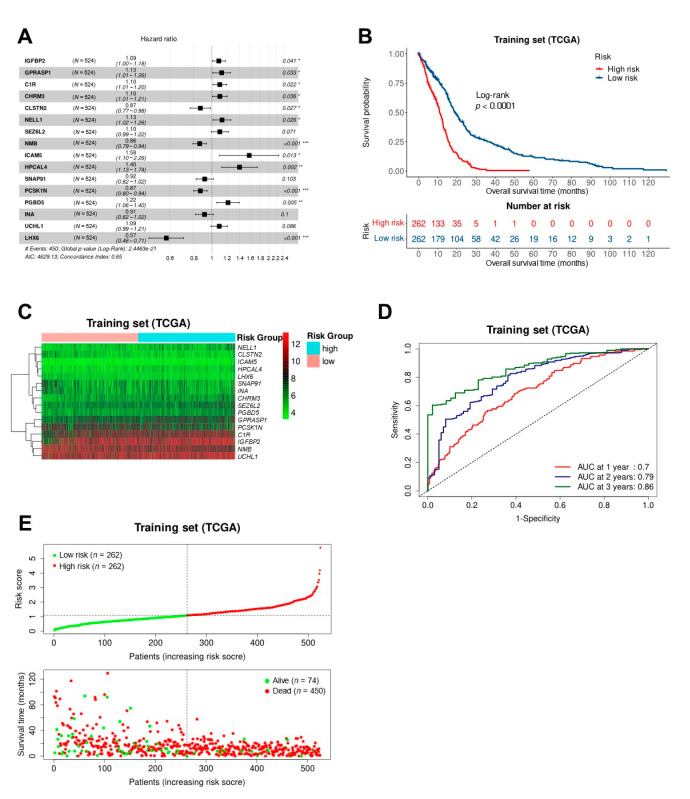
Figure 4.
Establishment of the survival risk model. (A) 16 genes were eventually selected to establish prognostic model. ***: p < 0.001, **: p < 0.01, *: p < 0.05; (B) Kaplan-Meier curve of overall survival in high- and low-risk group of the GBM patients in the training cohort; (C) Heatmap of 16 genes expression patterns; (D) ROC curves of the model for overall survival at 1-, 2-, and 3- years; (E) The distribution risk scores in the TCGA cohort.

