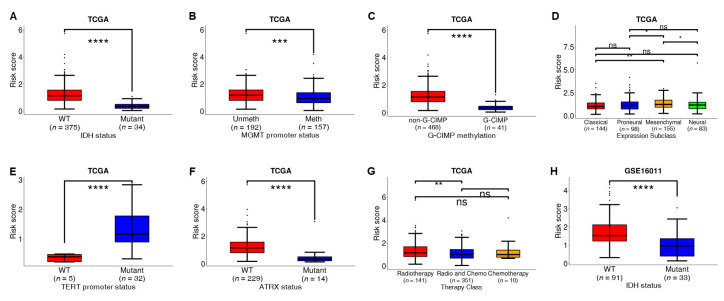
Figure 7.
Correlation between risk score and clinicopathology. (A,H) Comparison of risk scores in IDH-WT GBM and IDH-Mutant GBM in TCGA cohort and GSE16011 cohort; (B) Comparison of risk scores in MGMT-promoter- methylation, and MGMT-promoter- unmethylation GBM in the TCGA cohort; (C) Comparison of risk scores in G-CIMP and non-G-CIMP methylation GBM in the TCGA cohort; (D) Comparison of risk scores in Proneural, Neural, Classical, and Mesenchymal GBM in the TCGA cohort; (E) Comparison of risk scores in TERT-WT and TERT-Mutant GBM in TCGA cohort; (F) Comparison of risk scores in ATRX-WT and ATRX-Mutant GBM in the TCGA cohort; (G) Comparison of risk scores for therapeutic modalities in the TCGA cohort (only radiotherapy, radiotherapy and chemotherapy, only chemotherapy). ****: p ≤ 0.0001, ***: p ≤ 0.001, **: p ≤ 0.01, *: p ≤ 0.05, ns: p > 0.05.

