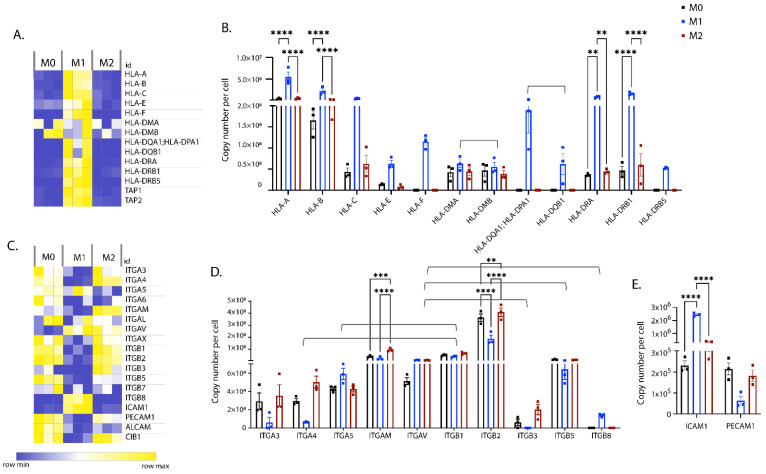
Figure 6.
Expression levels of MHC and cell adhesion molecules. Heat map showing concentrations (in nM) of HLAs (A) and adhesion molecules (C) across biological replicates of differentially polarised iPSDM. Graphs show the estimated copy numbers per cell of HLAs (B), integrins (D) and cell adhesion molecules (CAMs) (E) using a Proteomic ruler. p values: ** 0.01, *** 0.001, **** 0.0001.

