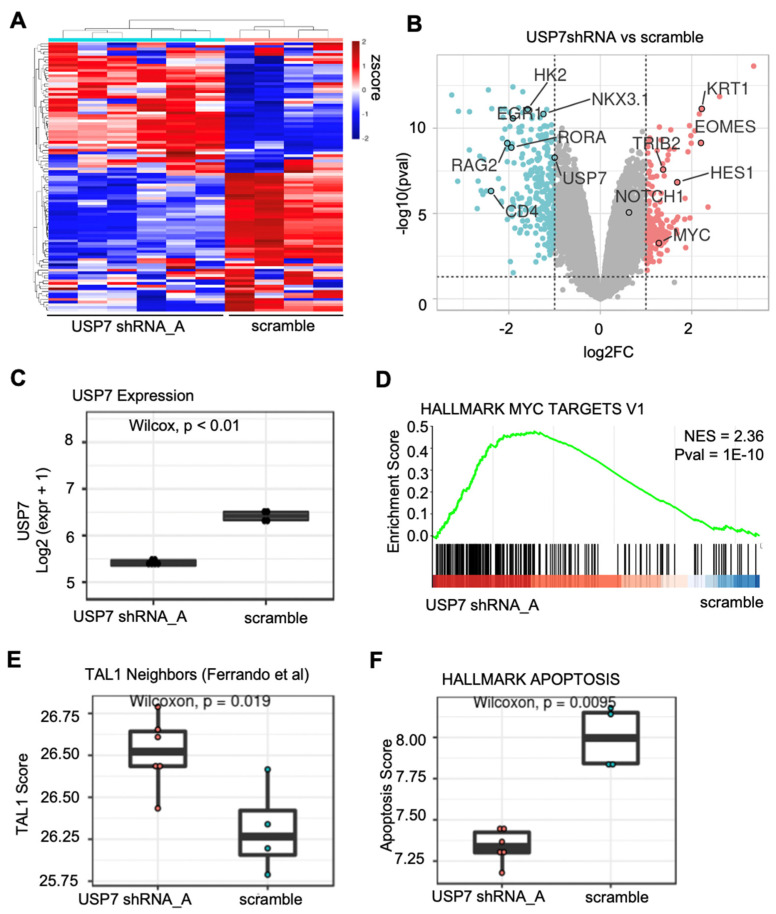
Figure 2.
Expression analysis example of RNA-seq data USP7 silenced Jurkat cells. (A) Unsupervised clustering of the RNA sequencing data using the top 100 genes ranked based on mean absolute deviation (MAD). (B) Differential gene expression analysis comparing USP7 knockdown and scramble. Genes upregulated after USP7 knockdown are shown in red and genes downregulated after USP7 knockdown are shown in blue (USP7-associated targets). (C) Boxplot showing the USP7 expression in log2 FPKM. (D) Gene set enrichment analysis of MYC targets. (E) Boxplot showing the single sample GSVA analysis of the TAL1 gene set. (F) Boxplot showing the single sample GSVA analysis of the Hallmark Apoptosis gene set.

