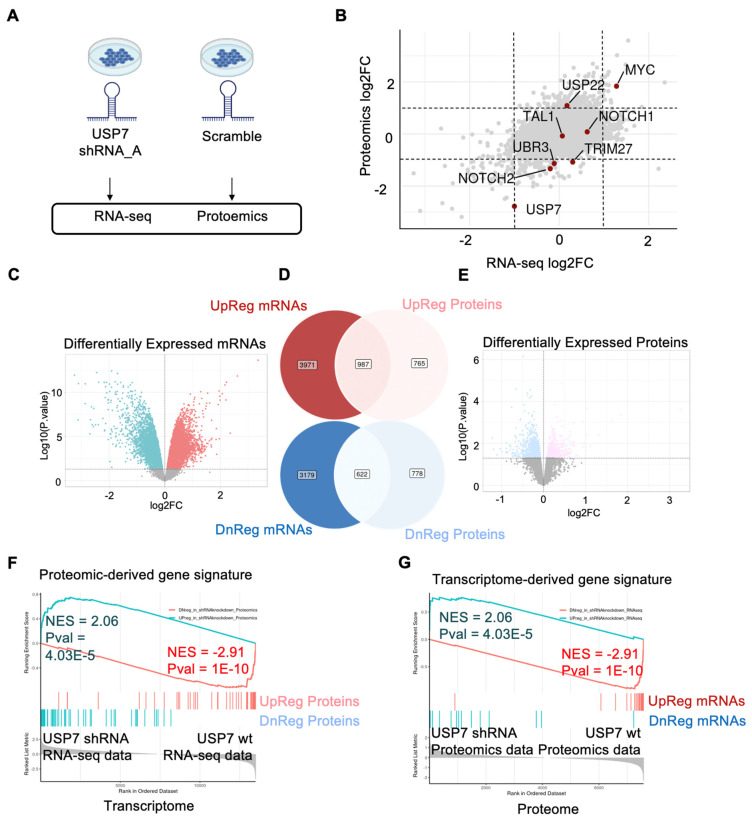
Figure 3.
Integrated analysis example of proteomics and transcriptomics USP7 silenced Jurkat cells. (A) Jurkat samples treated with USP7 shRNA and scramble were profiled by RNA sequencing and TMT mass spectrometry. (B) The log2 fold change from the differential expression analyses is plotted. Positive log2FC indicates upregulated expression after USP7 silencing. Negative log2FC indicates downregulated expression after USP7 knockdown. Dotted line indicates the −1 and 1 log2FC cutoff. (C) Upregulated and downregulated gene signatures derived from differentially expressed mRNAs. (D) Venn diagram of genes differentially upregulated (top panel) and downregulated (bottom panel) in the transcriptome (left) and proteome (right). (E) Up-regulated and downregulated gene signatures derived from differentially expressed proteins. (F,G) Reciprocal GSEA of differentially expressed genes derived from the transcriptome and examined in the proteomics data (F). Similarly, differentially expressed proteins were first derived then examined in the transcriptome data by GSEA (G).

