Figure 4.
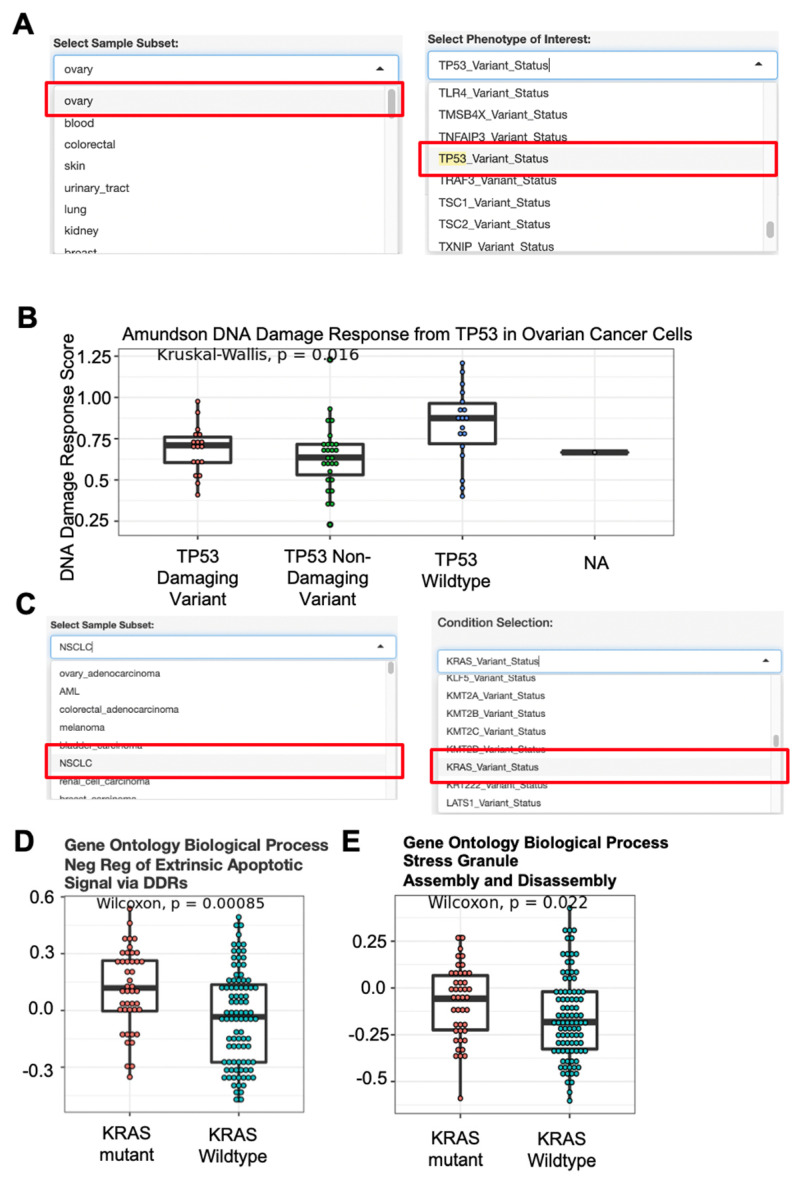
Use case analysis example of CCLE Expression data. (A) Drop-down menu selection of sample cohort and sample phenotype characteristic. CCLE ovary samples and TP53 mutation status were selected from the drop-down menu option. (B) Single-sample GSEA analysis of genes defining the DNA damage response by Amundson et al. Analyzed samples were selected from the drop-down menu from (A). (C) Drop-down menu selection of sample cohort and sample phenotype characteristic. CCLE non-small cell lung cancer samples and phenotype associated with the KRAS mutation status were selected from the drop-down menu option. (D) Single sample GSEA analysis of genes negatively regulating the DNA damage response. (E) Single sample GSEA of genes defining the stress granule assembly and disassembly. Gene sets were compiled from Biological Pathways from the Gene Ontology database (GOBP). Analyzed samples were selected from the drop-down menu from (C).

