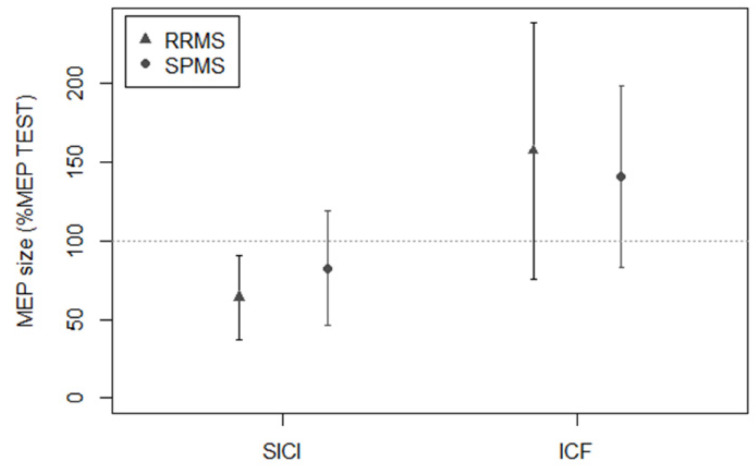
Figure 2.
Transcranial magnetic stimulation assessment in subjects with RRMS and SPMS. SICI, as tested by paired-pulse stimulation with a 3 ms ISI, was significantly lower in SPMS than in RRMS. ICF, as tested by paired-pulse stimulation with a 10 ms ISI, was similar in RRMS and SPMS. Y axis: MEP size, expressed as conditioned MEP amplitude/test MEP amplitude × 100. Bars represent standard deviation.

