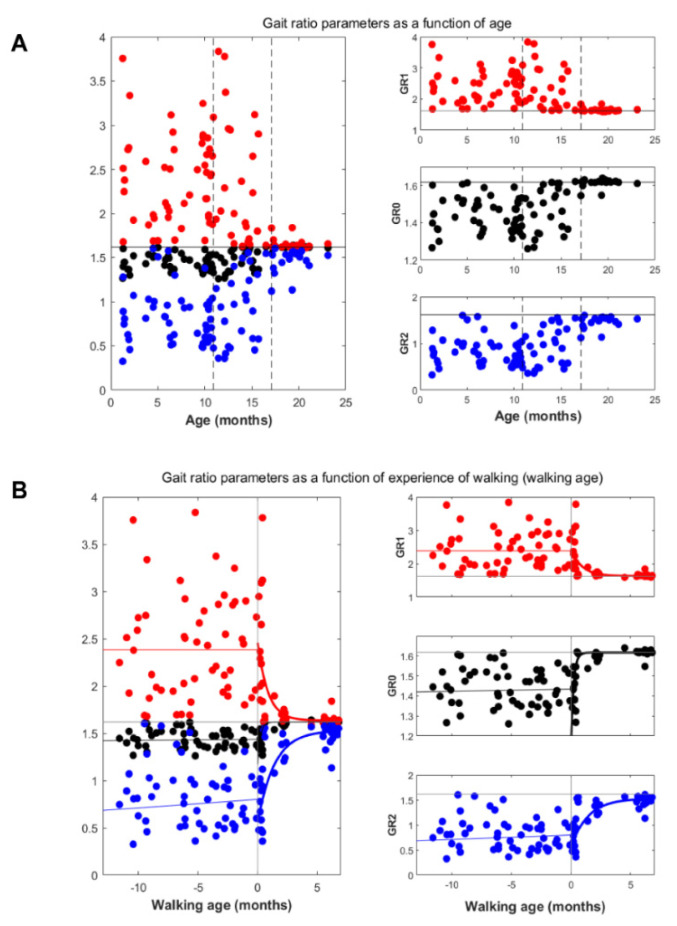
Figure 1.
Gait ratios GR as a function of age (panel A), and as a function of walking age (panel B). In (panel A), dashed lines were added to mark the temporal range comprising the minimum and maximal value of walking onset (min and max values: 10.5 and 16.7 months, respectively). The three panels on the right side depict the three parameters: GR0 (black), GR1 (red), and GR2 (blue). The horizontal grey lines mark the value of the golden ratio, which is rounded at 1.618. In (panel B), the dashed line marks the beginning of independent walking while a solid curve was obtained by data fitting.

