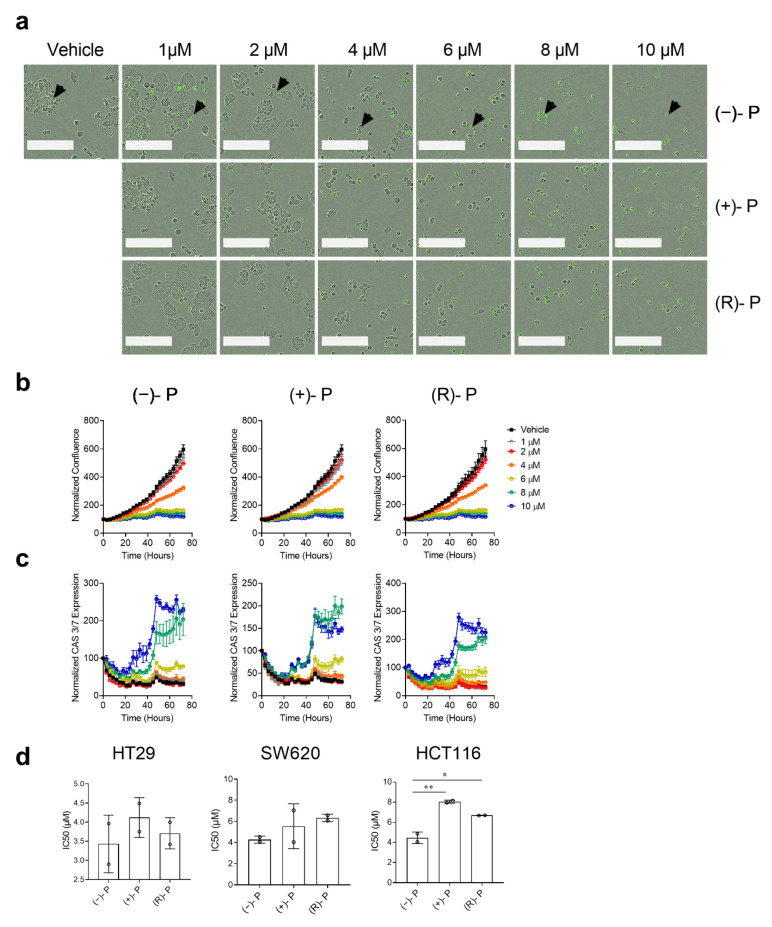
Figure 3.
The kinetics of (−)-P-, (+)-P- and (R)-P-mediated apoptosis of CRC cells grown in monolayers. CRC cells were monitored for 72 h in the presence of (−)-P, (+)-P and (R)-P and Caspase-3/7 Green reagent using an Incucyte S3 Live Analysis System. (a) Representative images of HT29 cells 72 h post drug treatment. Caspase 3/7 positive cells are shown as green, indicated by the black arrows in (−)-P. The white bar represents 200 µm. (b) Cell growth curves measured by calculating the confluence (%) from time 0. (c) Caspase 3/7 kinetics curves measured by calculating CAS 3/7+ (green) cells normalized to time 0. Individual points represent the mean ± SD from three technical replicates in a single experiment. Data are representative of two independent experiments. (d) The IC50 values for the HT29, SW620 and HCT116 cell lines calculated and pooled from two independent experiments. Mean ± SD, * p ≤ 0.05, ** p ≤ 0.001. One-way ANOVA with a multiple comparisons test.

