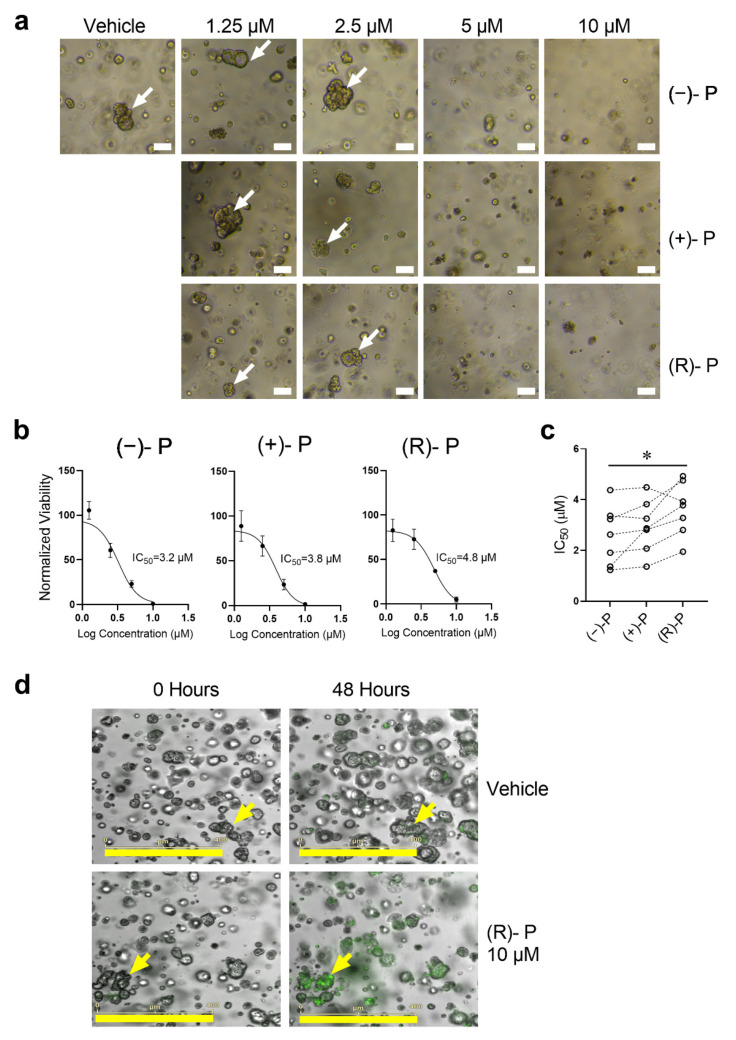
Figure 5.
Disruption of CRC organoid structure following treatment with (−)-P, (+)-P or (R)-P. CRC organoids were grown for 48 h followed by treatment with (−)-P, (+)-P and (R)-P for 144 h. Images were taken before the addition of AlamarBlue dye. (a) Representative images of patient-derived liver metastatic CRC organoids (TQEH196) treated with (−)-P, (+)-P and (R)-P. White bars represent 100 µm. White arrows indicate viable organoids. (b) Growth curve and calculated IC50 values for (−)-P, (+)-P and (R)-P of TQEH196. Individual points represent mean ± SD from four technical replicates. (c) IC50 values for seven individual CRC patients. Dashed line denotes organoid IC50 responses from the same patient. * p ≤ 0.05, Friedman repeated measure ANOVA. (d) Representative images showing caspase 3/7 activation (green) denoting apoptosis by 10 μM of (R)-P in a patient-derived organoid 48 h post treatment. Yellow bars represent 400 µm; yellow arrows represent organoids tracked overtime.

