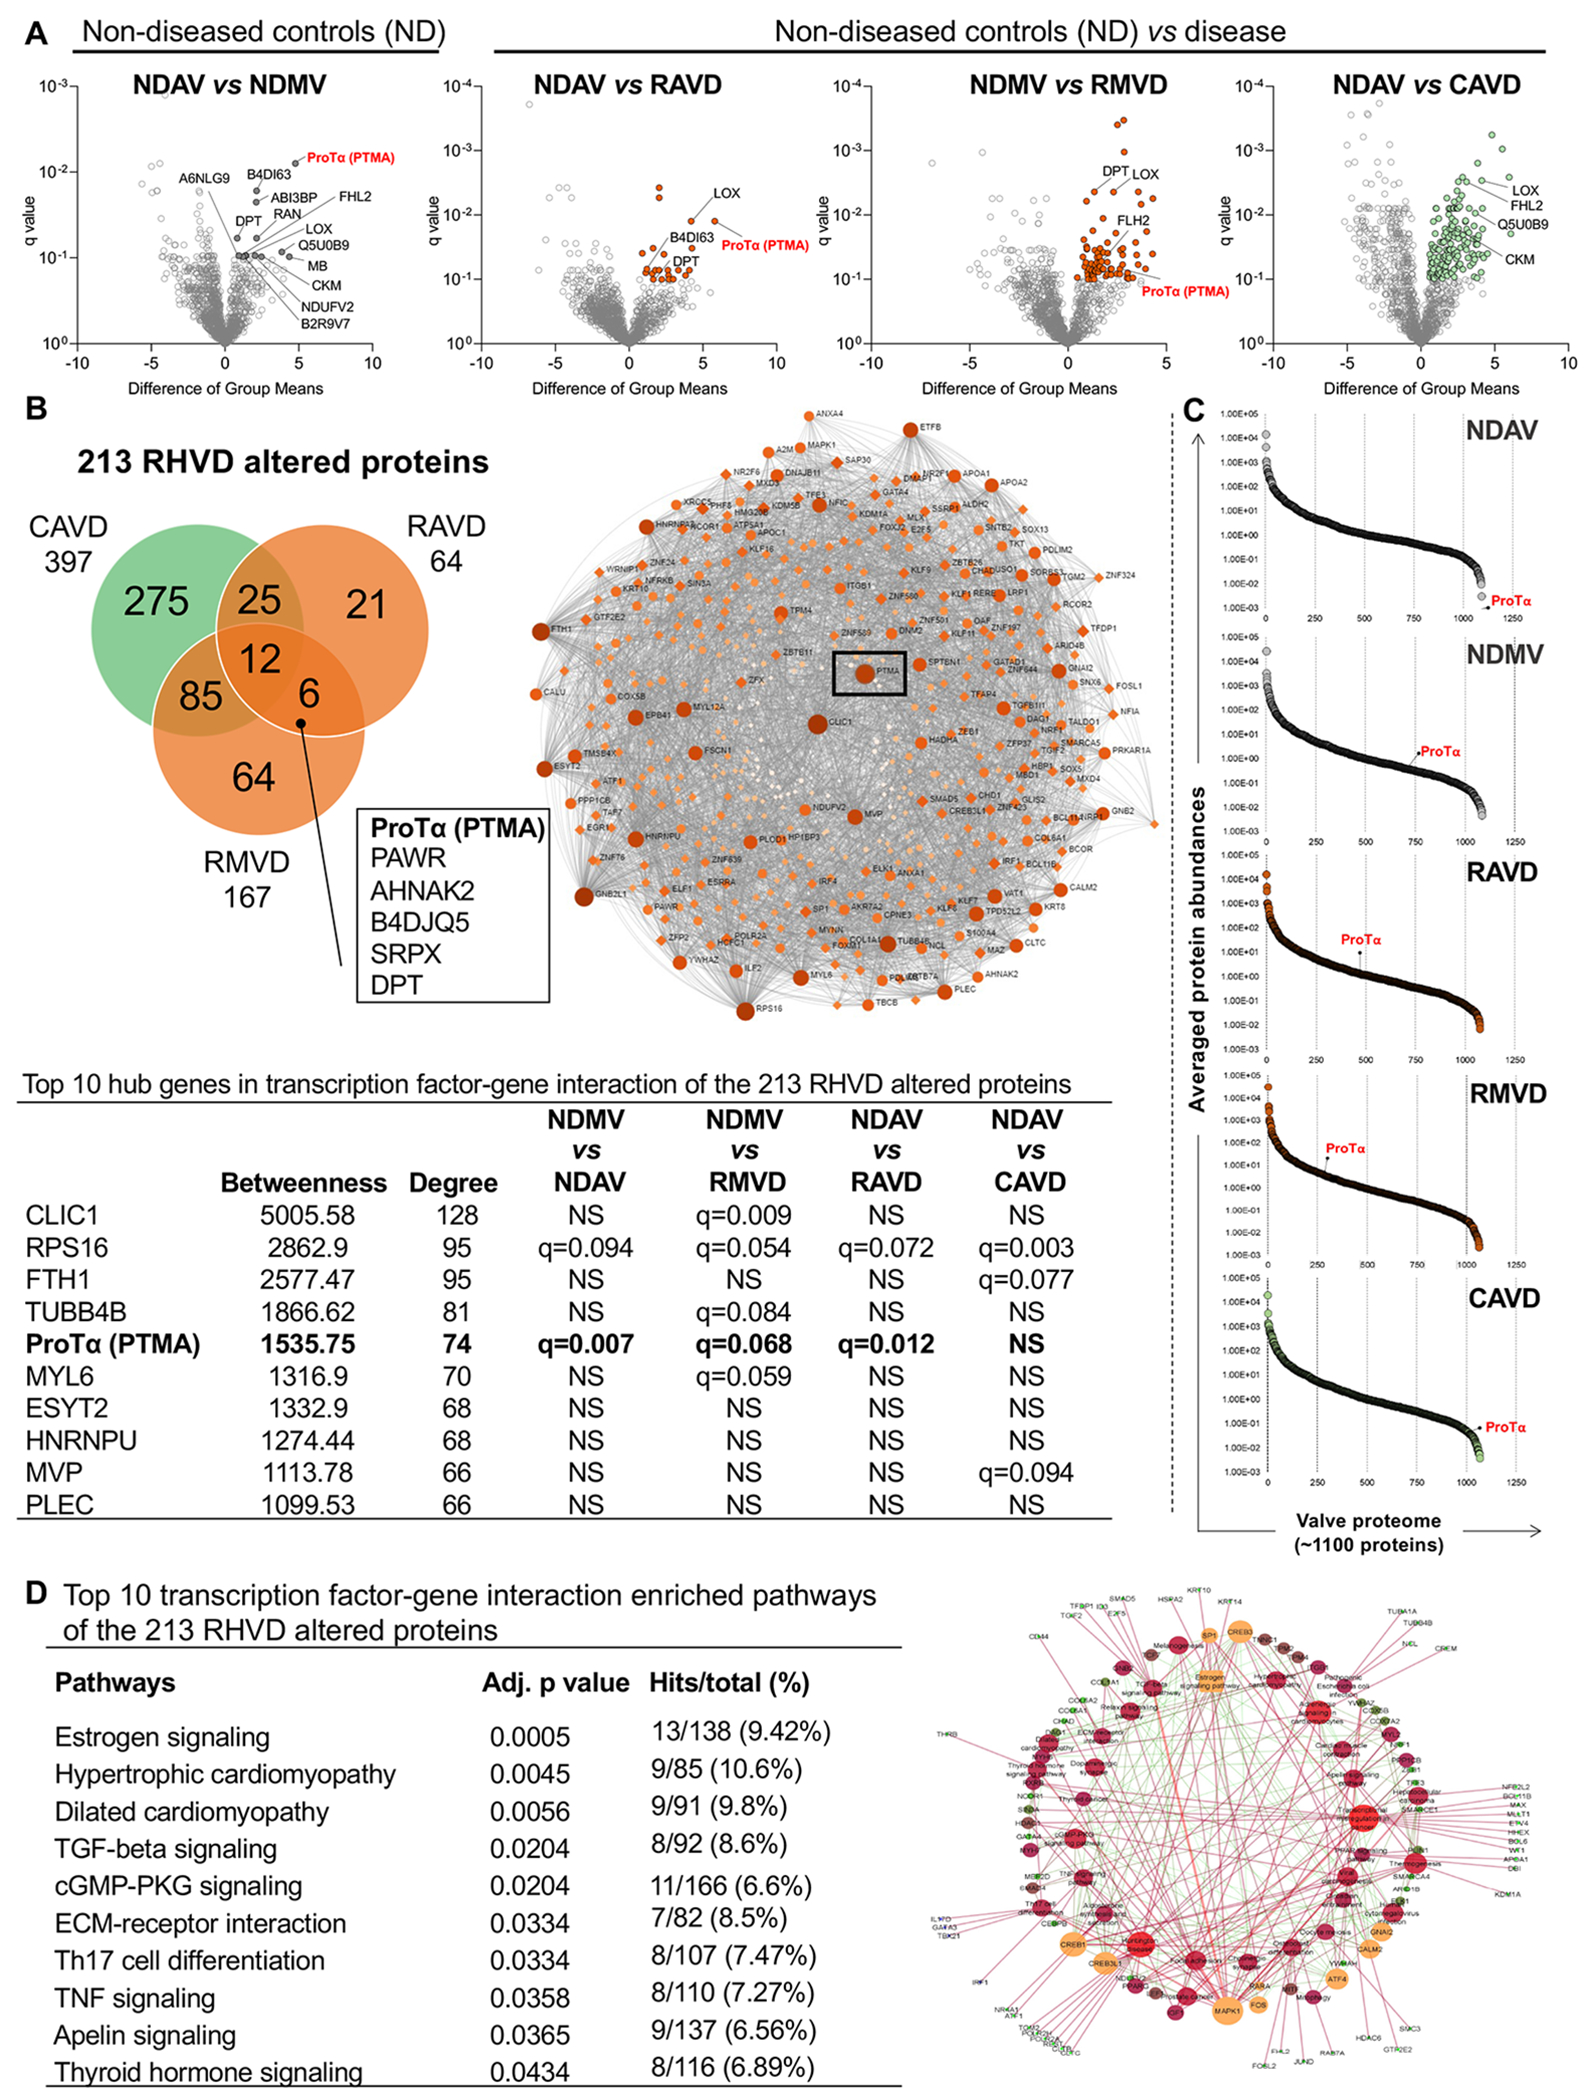
Figure 1: Whole tissue proteomics and network analysis of non-diseased, rheumatic, and calcific human heart valves.

A, Volcano plots comparing ‘difference of group means’ of protein abundances in the valvular tissue proteome per ‘q value’. Group comparisons are indicated for each volcano plot. Significantly up-regulated genes are highlighted (q<0.1). B, Venn diagram showing the intersection of altered proteins from rheumatic and calcific heart valves proteomes. Proteins at the intersection of each pair of group comparison are shown. Box shows the common 6 proteins altered in both rheumatic aortic and mitral proteomes. C, Percentile ranking plots of averaged protein abundances of the valvular tissue proteomes for each group. ProTα location is mapped in each percentile rank plot. Transcription-factor network analysis shows that ProTα as a hub gene in RHVD altered proteome (q<0.1). D, Top 10 transcription-factor pathway analysis overrepresented in RHVD altered proteome (q<0.1). Abbreviations: NDAV, non-diseased aortic valves (n=6); NDMV, non-diseased mitral valves (n=6), RAVD, rheumatic aortic valve disease (n=4), RMVD, rheumatic mitral valve disease (n=9); CAVD, calcific aortic valve disease (n=5). Significantly differentially enriched proteins were calculated using a two-group comparison by adjusting individual p values from every pairwise comparison for significance (q<0.1). Enriched pathways were considered statistically significant when adjusted p values were ≤0.05.
