
Figure 3: In vitro analysis of the effects of recombinant ProTα on CD8+ T-cells.
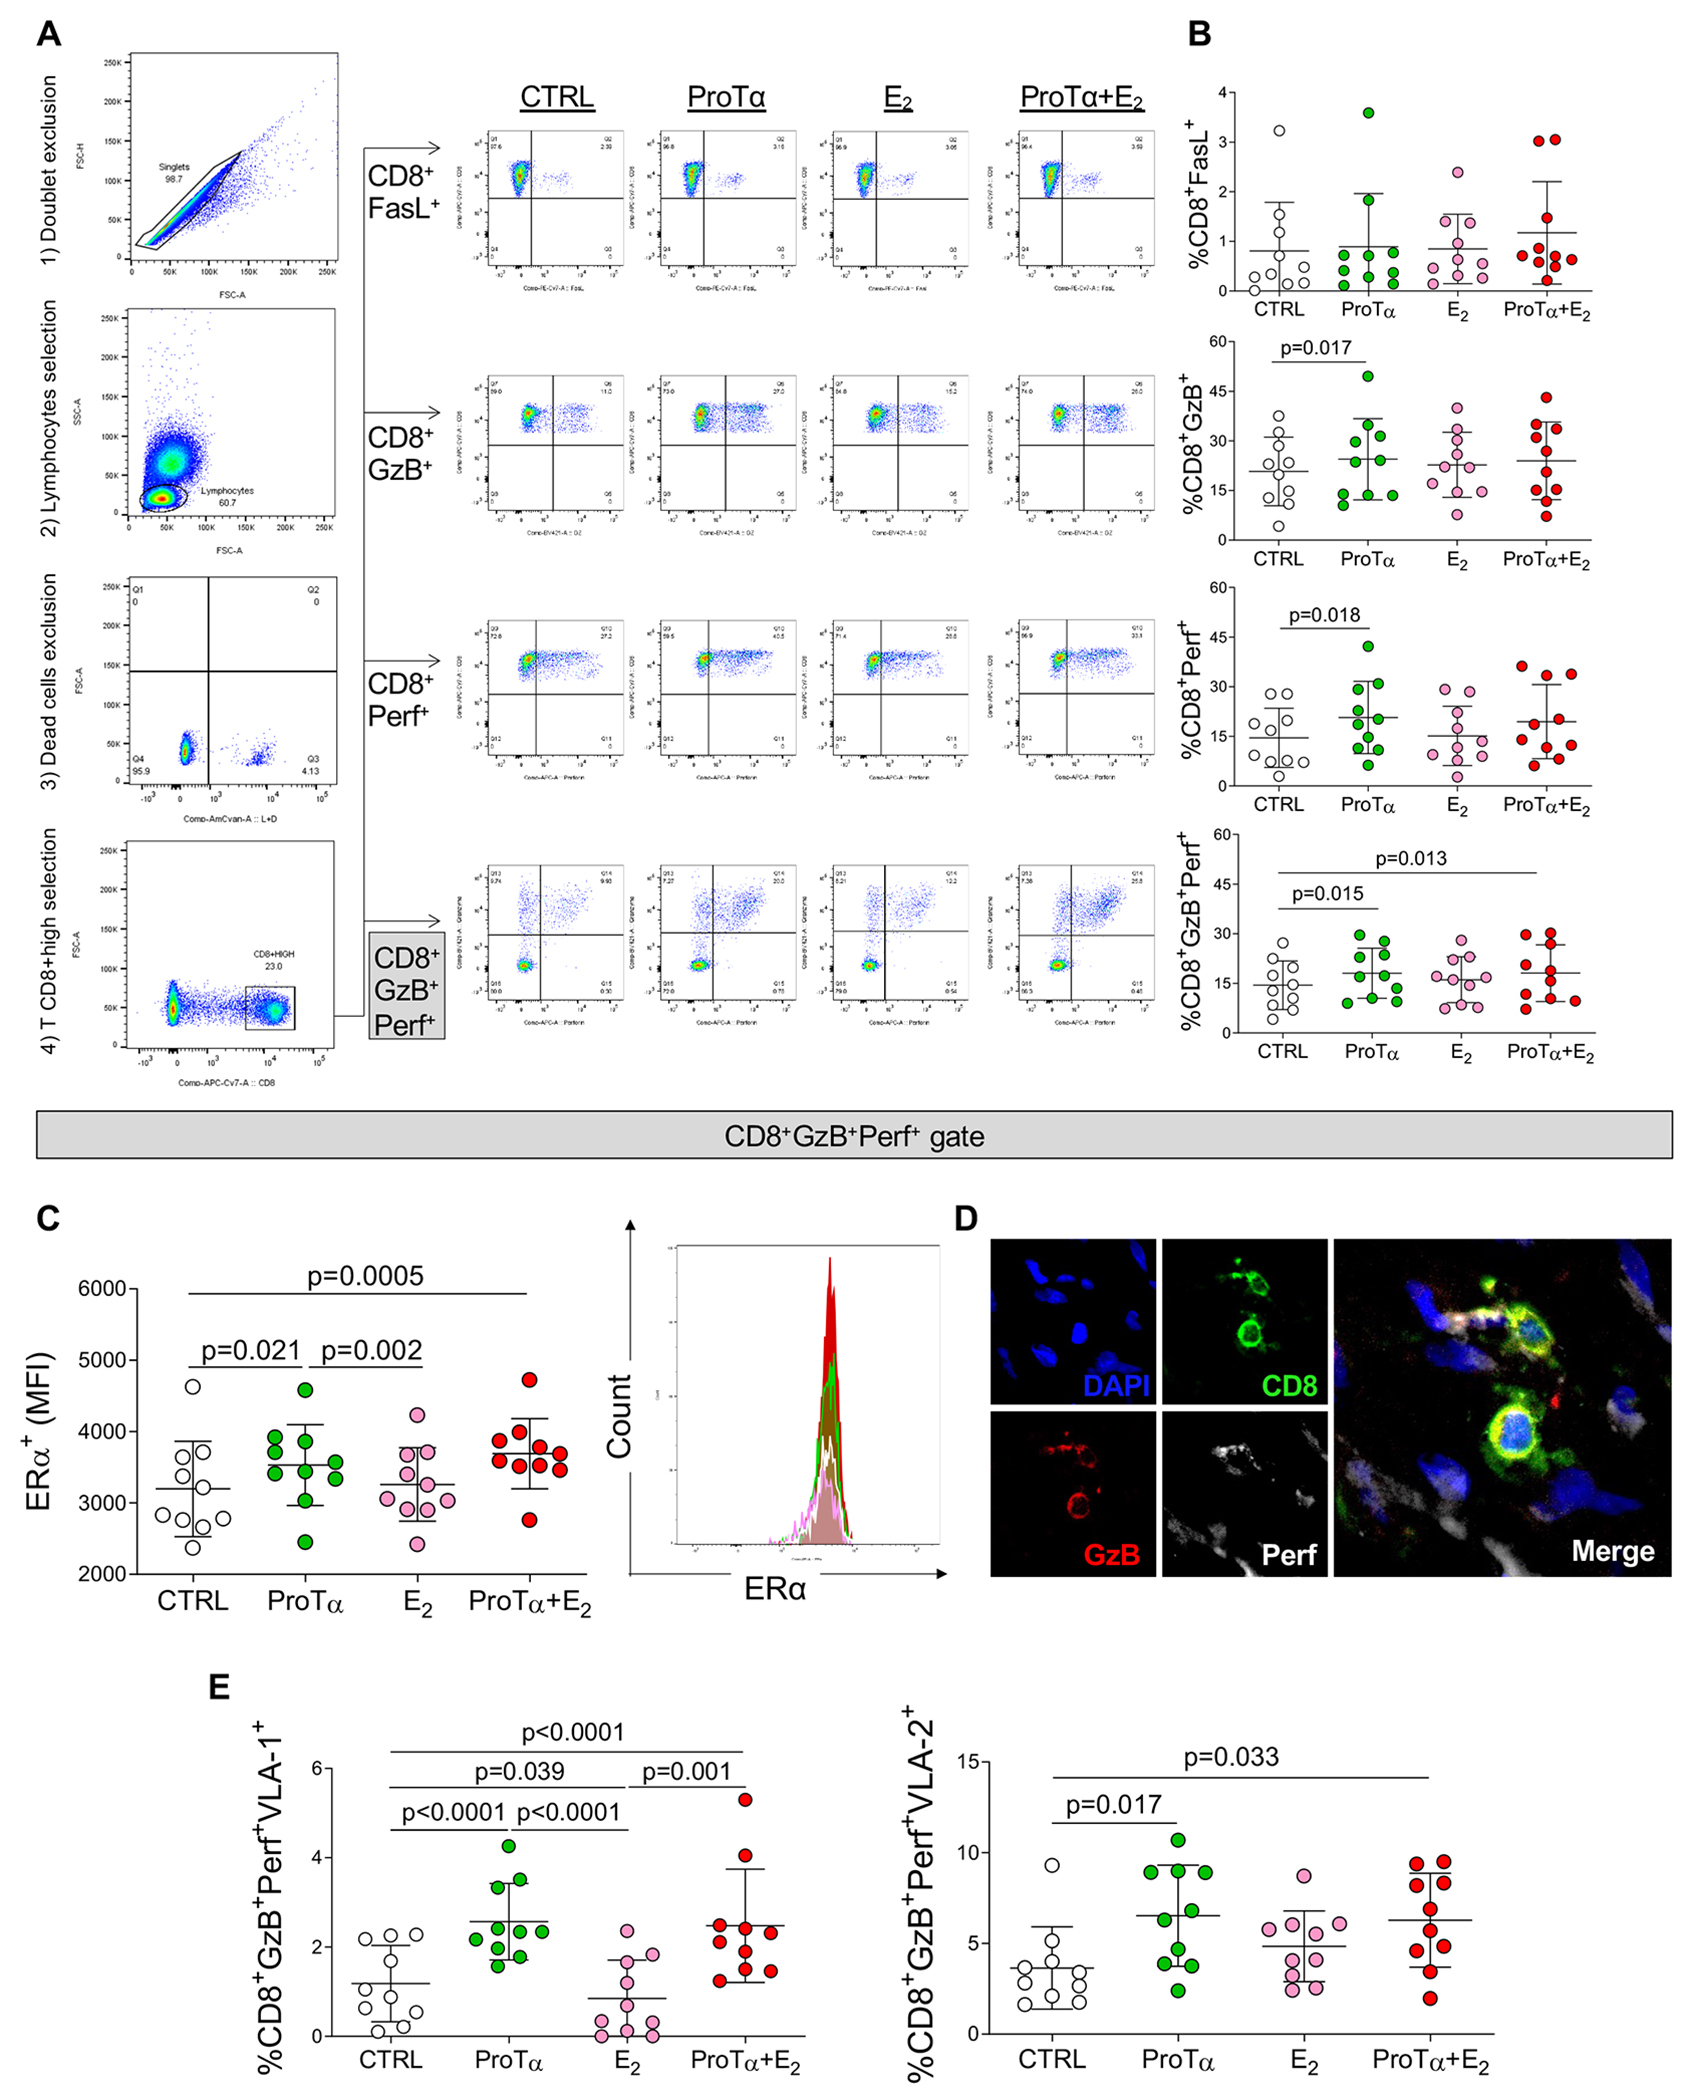
A, Representative gating strategy scatter plots to evaluate markers of cytotoxicity in CD8+ T-cells. After cell doublets exclusion, total lymphocytes region was gated based on cell size (forward scatter/FSC) and cell complexity (side scatter/SSC). Dead cells were excluded using a cell viability dye. CD8+ high cell population was gated to further analyze the markers of cytotoxicity: FasL, granzyme-B and perforin. Control cultures (non-stimulated, CTRL) are represented by white dots, ProTα stimulated cultures are represented by green dots, estradiol stimulated cultures (E2) are represented by pink dots, cultures stimulated by both ProTα and E2 (ProTα+E2) are represented by red dots. B, Frequency of CD8+ cells expressing FasL (CD8+FasL+), granzyme-B (CD8+GzB+), perforin (CD8+Perf+) and (CD8+GzB+Perf+). C, Mean intensity of fluorescence (MFI) of estrogen receptor alpha (ERα) gated in CD8+GzB+Perf+ cells. Representative histogram showing the MFI of ERα in the different culture conditions. D, Representative direct immunofluorescence staining for CD8, GzB and Perf in RHVD valvular lesion. Scale bars = 50 μm. E, Frequency of VLA-1 (CD8+GzB+Perf+VLA-1+) and VLA-2 (CD8+GzB+Perf+VLA-2+) gated in CD8+GzB+Perf+. Bar graphs show the mean of values in each group (n=10) and standard deviation. Comparisons among non-stimulated and stimulated cell cultures were made using two-way ANOVA followed by Tukey’s test. Statistical significance is indicated in each graph.