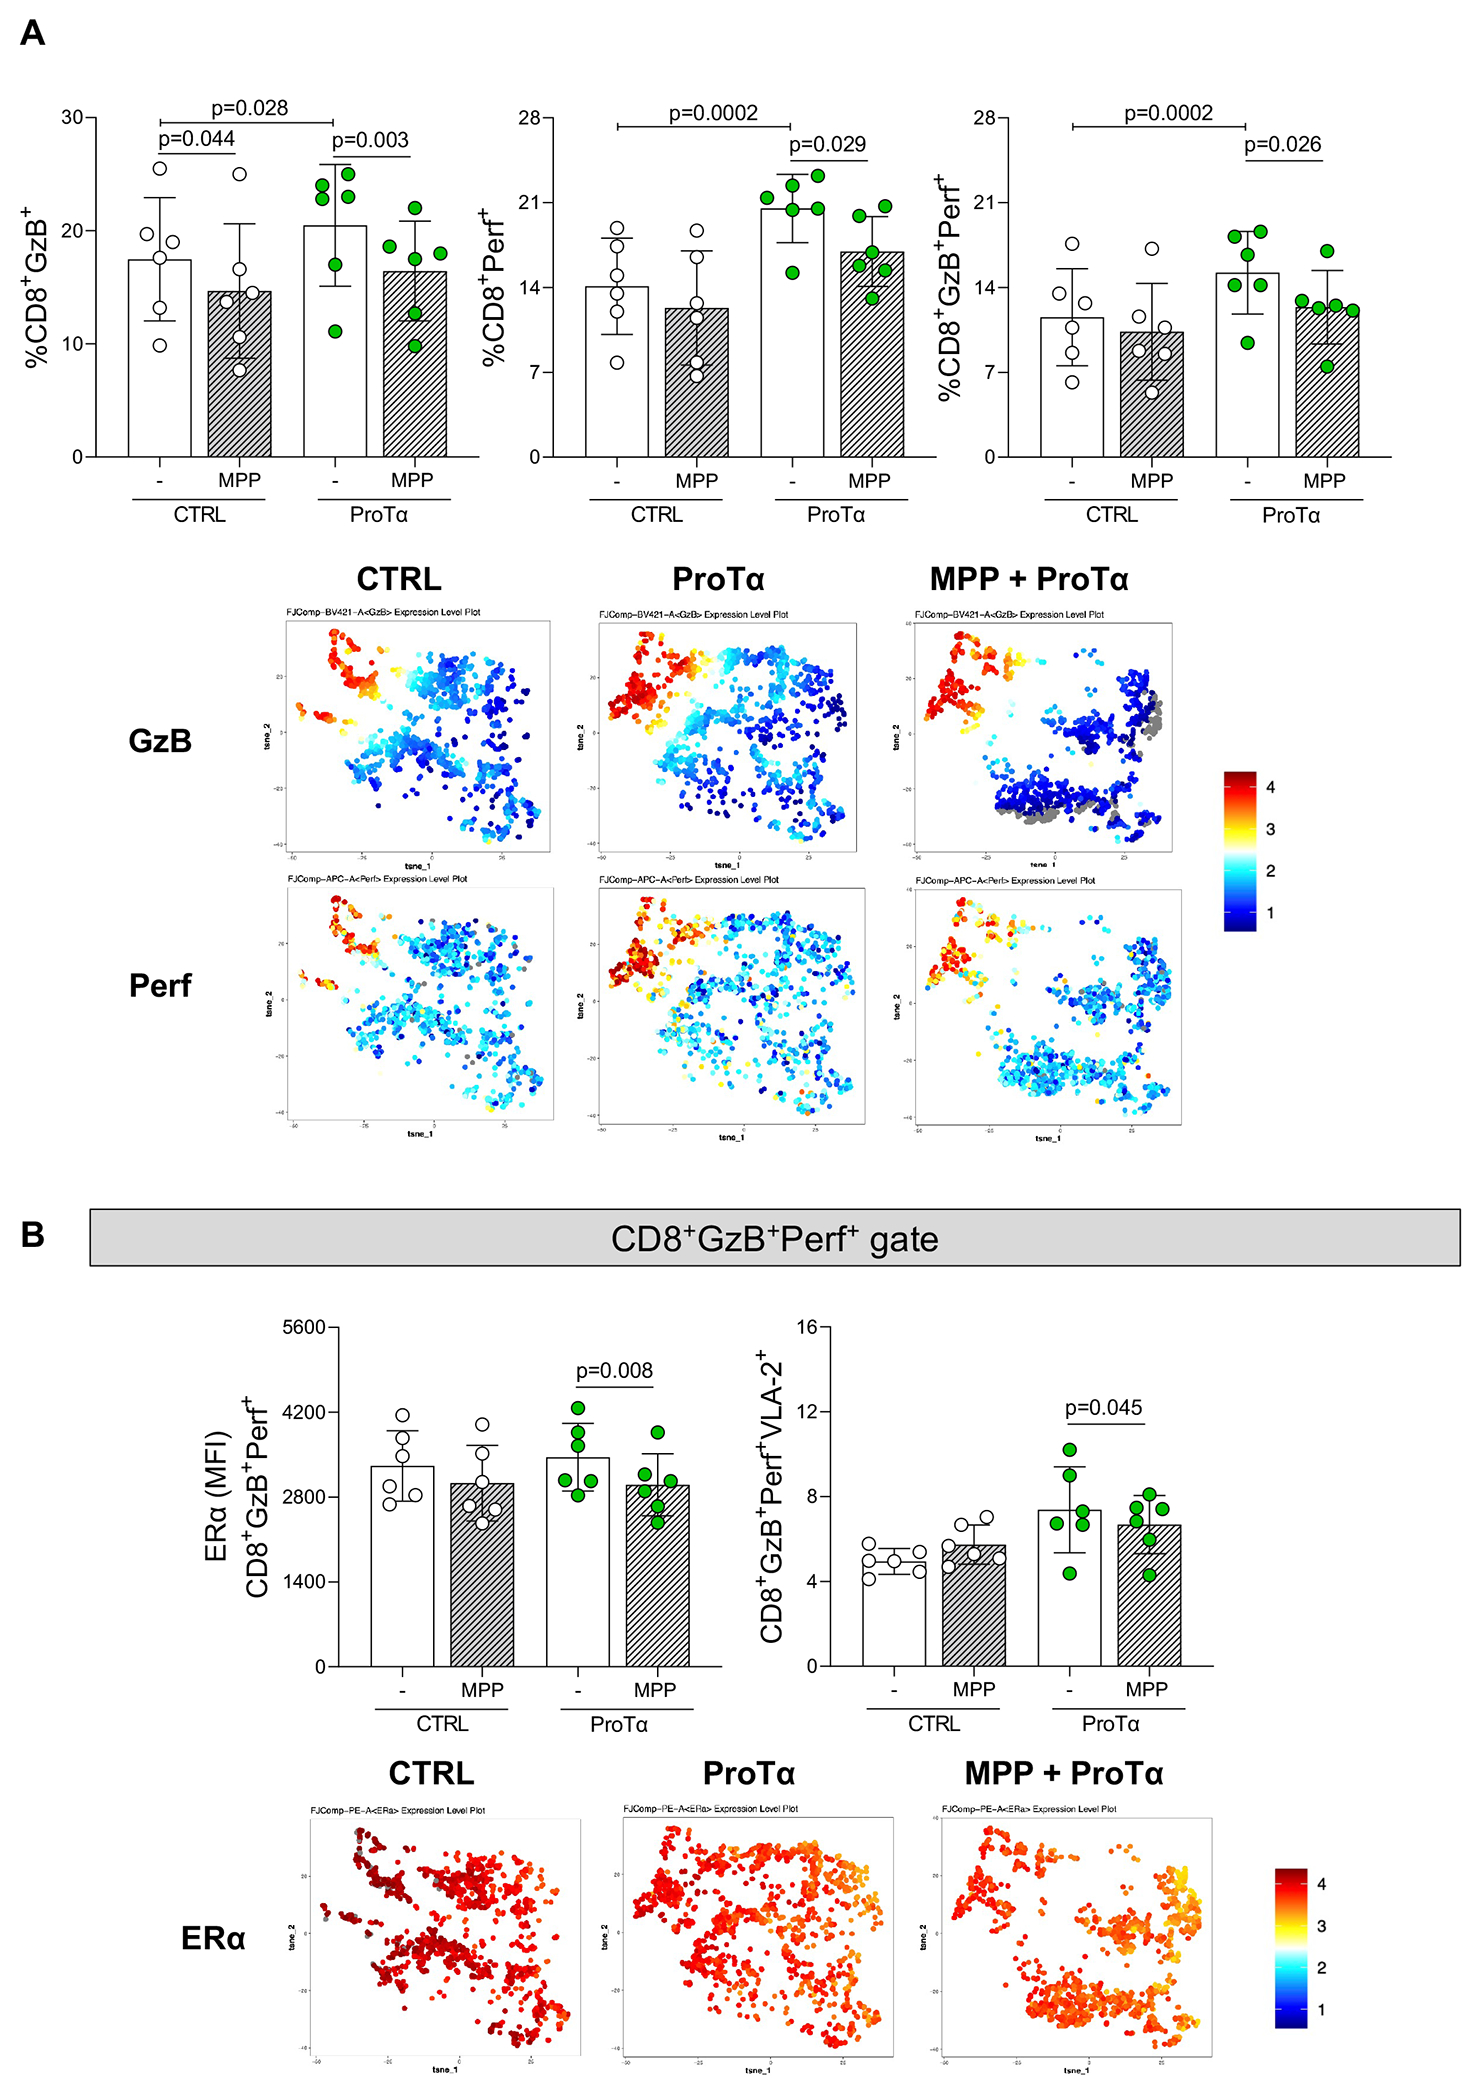
Figure 6: Effects of a highly selective ERα antagonist on CD8 T-cells cytotoxicity and VLA-2 expression induced by ProTα.

A, Comparison of the frequency CD8 T-cells expressing the cytotoxicity markers granzyme-B and perforin (%CD8+GzB+,%CD8+Perf+ and %CD8+GzB+Perf+) in peripheral blood mononuclear cells unstimulated (CTRL, white dots) and ProTα stimulated (green dots) in the absence (−) or in the presence of 4 uM (thick crosshatched) of 1,3-Bis(4-hydroxyphenyl)-4-methyl-5-[4-(2-piperidinylethoxy)phenol]-1H-pyrazole dihydrochloride (MPP), a highly selective ERα antagonist. Representative tSNE of GzB and Perf expression on CTRL, ProTα stimulated (ProTα), and ProTα stimulated pre-treated with 4 uM of MPP (MPP 4 uM + ProTα). Colors correspond to phonograph-guided clustering. B, Comparison of the median of fluorescence intensity of ERα and frequency of VLA-2 in CD8+GzB+Perf+ T-cells. Representative tSNE of ERα ex pression on CTRL, ProTα stimulated (ProTα), and ProTα stimulated pre-treated with 4 uM of MPP (MPP 4 uM + ProTα). Colors correspond to phonograph-guided clustering. Bar graphs show the mean of values in each group (n=6) and standard deviation. Comparisons between non-stimulated (CTRL) and stimulated (ProTα) cell cultures and between non-MPP treated and MPP-treated were made using a two-way ANOVA followed by Tukey’s test. . Statistical significance is indicated in each graph.
