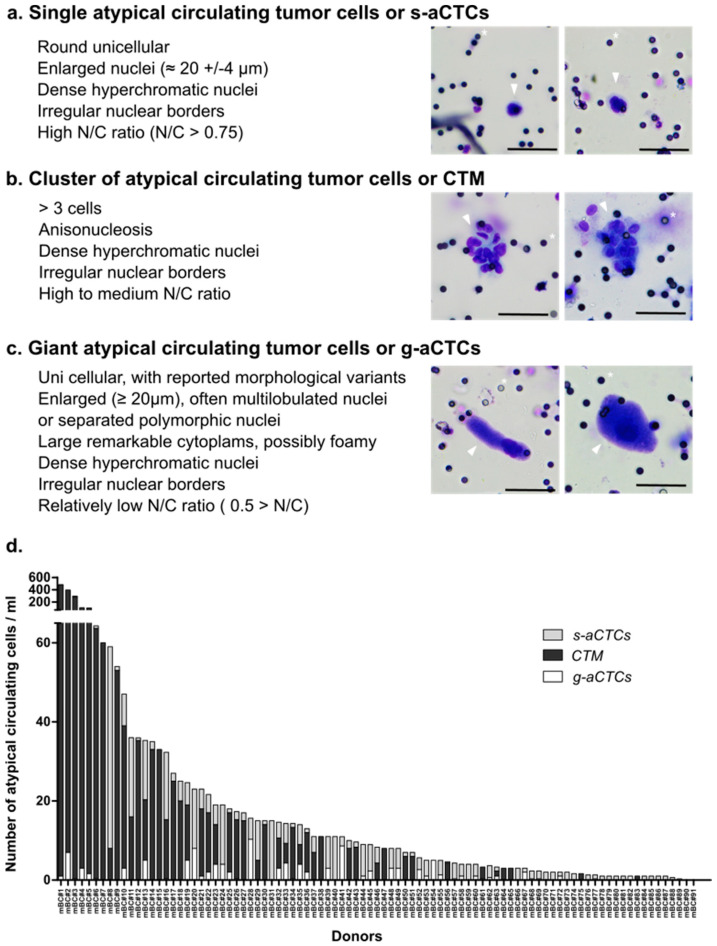
Figure 1.
Images of atypical circulating cells and respective subsets’ distribution in mBC patients. (a–c) May–Grünwald staining of aCTCs isolated from the blood of mBC patients using the Screencell®Cyto device: (a) single cell or s-aCTCs; (b) cluster of cells or CTM; (c) giant cells or g-aCTCs. Small black dots are filter’s pores, marked with a white asterisk. Cells of interest are marked with an arrow. Scale represents 50 µm; (d) distribution of aCTC subsets in mBC patients (n = 91). Number of s-aCTC, CTM and g-aCTC are indicated per mL of blood.

