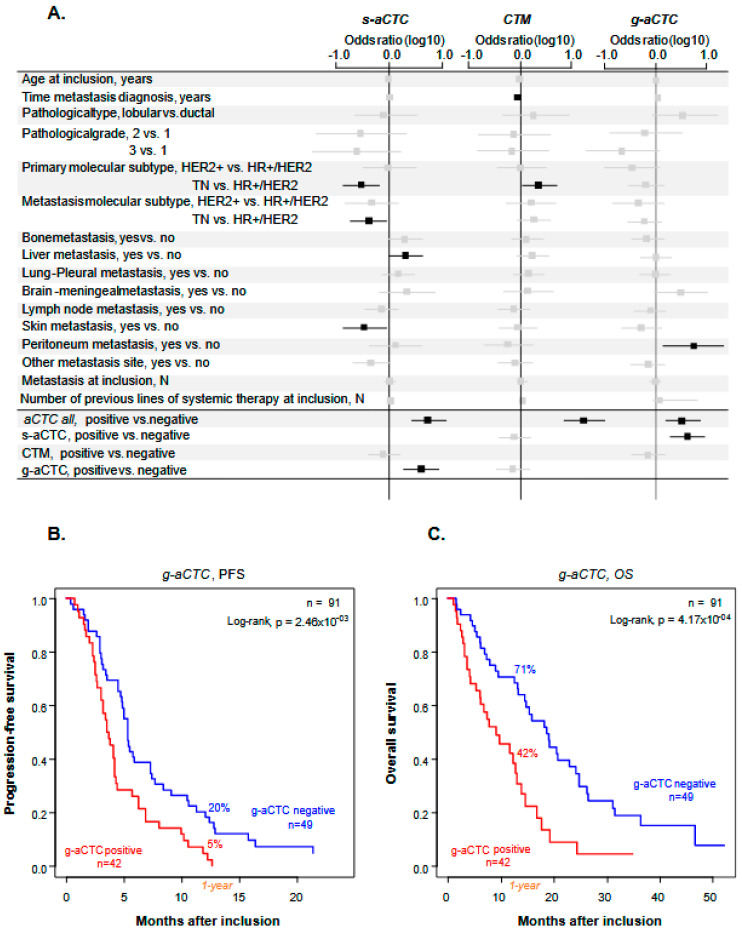
Figure 2.
Correlations between aCTC subsets, clinicopathological variables and survival data. (A) Forest plot representation of the correlation between the total number of atypical cells detected or individual atypical cell subsets and clinical data (n = 91 patients). Odds ratios are indicated with confidence intervals (horizontal lines). Statistically significant data are in black, statistically insignificant data (crossing 0, vertical line) are in grey; (B,C) Kaplan–Meier PFS (B) and OS (C) curves of mBC patients according to the presence of g-aCTCs. Data are represented as mean ± SEM (n = 3). Differences were considered significant at p < 0.05. TN: triple-negative, HR+: Hormone Receptive-positive, HER2−/+: HER2 negative/positive.

