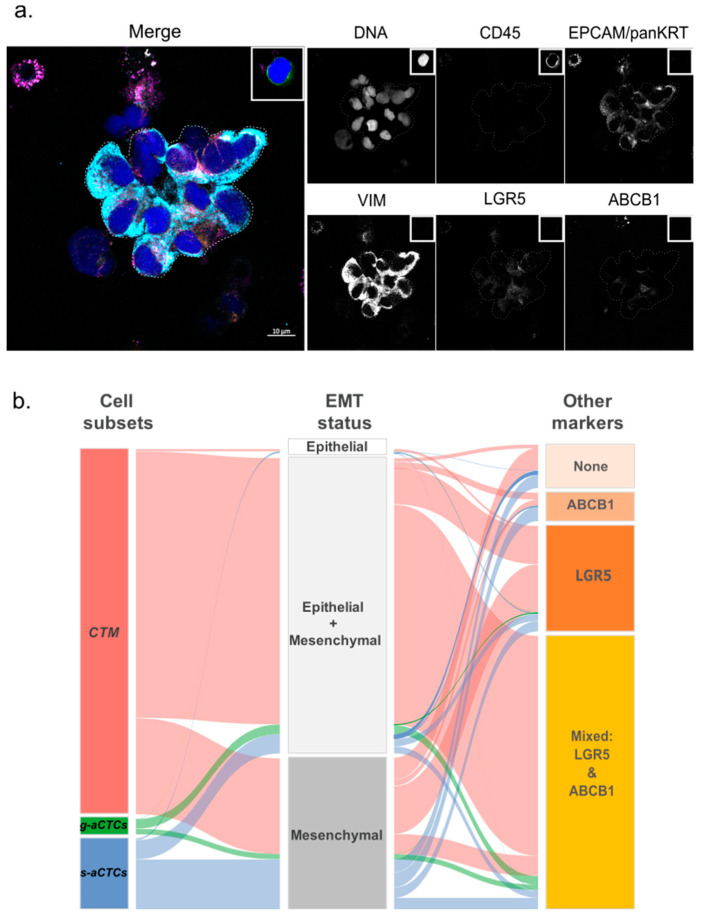
Figure 3.
Example of the immunofluorescence staining of CTM isolated on ScreenCell® filters. (a) Immunostaining of a CTM immobilized on the filter. This CTM shows a hybrid EMT status (EPCAM+, pan-KRT+, and VIM+) and weak expression of LGR5 and ABCB1. The staining obtained for a leukocyte (CD45+) is represented in the insert (top right) of each channel. Scale bar represents 10µm; (b) alluvial plot representation of the correlations between aCTC subsets and molecular markers. The graph shows the combined expression of EMT, stem-like and efflux pump markers for the three subsets of atypical cells (CTM, g-aCTCs, and s-aCTCs). The height of the blocks represents the size of the population: The thickness of a stream represents the number of cells contained in blocks interconnected by the stream.

