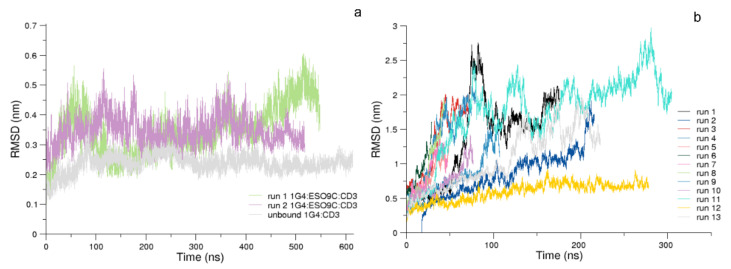
Figure 4.
The C-α RMSD. In panel (a), the RMSD of the 1st run of 1G4:ESO9C:CD3 (lilla), the 2nd run of 1G4:ESO9C:CD3 (light green), and of the unbound 1G4:CD3 (gray). In panel (b), the RMSD of the 13 trajectories of the 1G4:ESO4D:CD3 complex; in all these simulations, the dissociation of the pMHC was observed, except for run 12 (gold).

