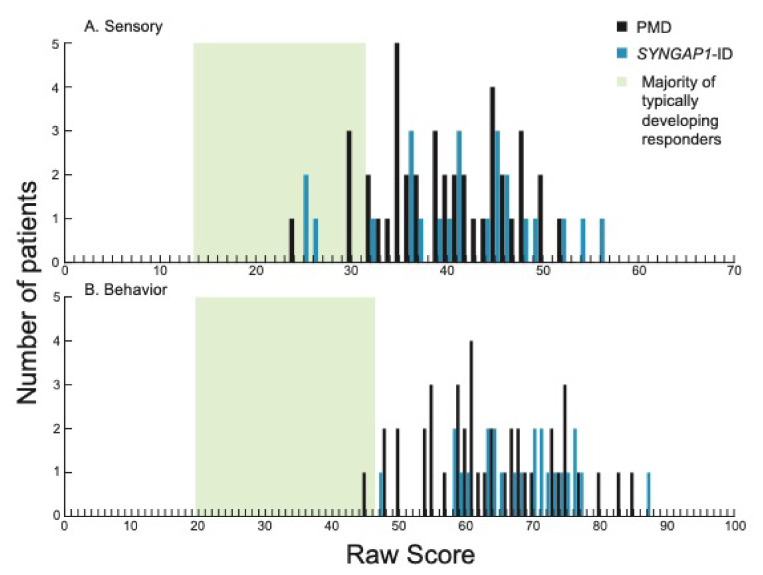
Figure 1.
Distribution of scores in each of the two sections on the SSP-2 for PMD and SYNGAP1-ID. Histograms showing number of PMD patients (black) and SYNGAP1-ID patients (blue) with each raw score in the sections of (A) sensory and (B) behavior. Green box indicates range of scores associated with the majority of typically developing responders based on prior validation of the SSP-2 [24]. PMD: Phelan-McDermid Syndrome. SYNGAP1-ID: SYNGAP1-related Intellectual Disability. SSP-2: Short Sensory Profile-2.

