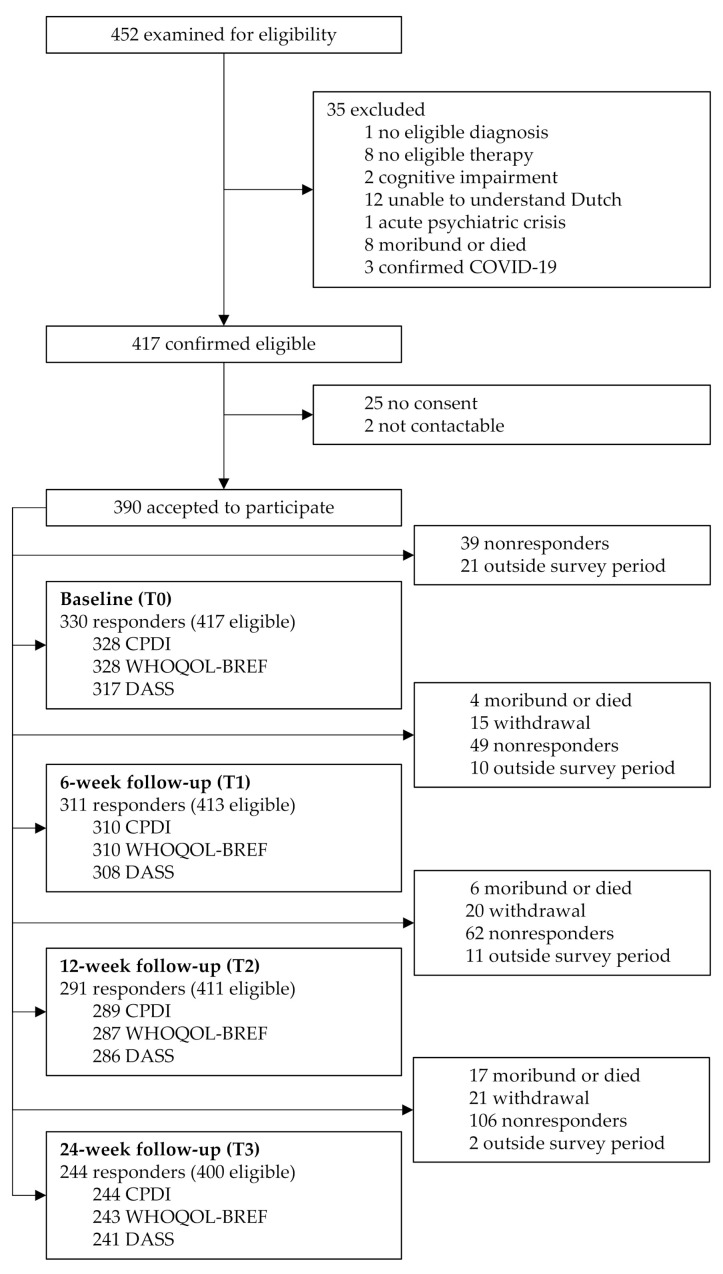
Figure 1.
ONCOVID study flow diagram. All the exclusion boxes in the right margin originate from the start; the numbers within these boxes should be subtracted from 390 and 417 to obtain the responders and eligible individuals at the given survey period, respectively (e.g., at T2, 291 [=390-6-20-62-11] responders out of 411 [=417-6] eligible individuals). All eligible individuals were invited to complete each survey. Questionnaires were optional; in such cases, responders may vary because of non-response.

