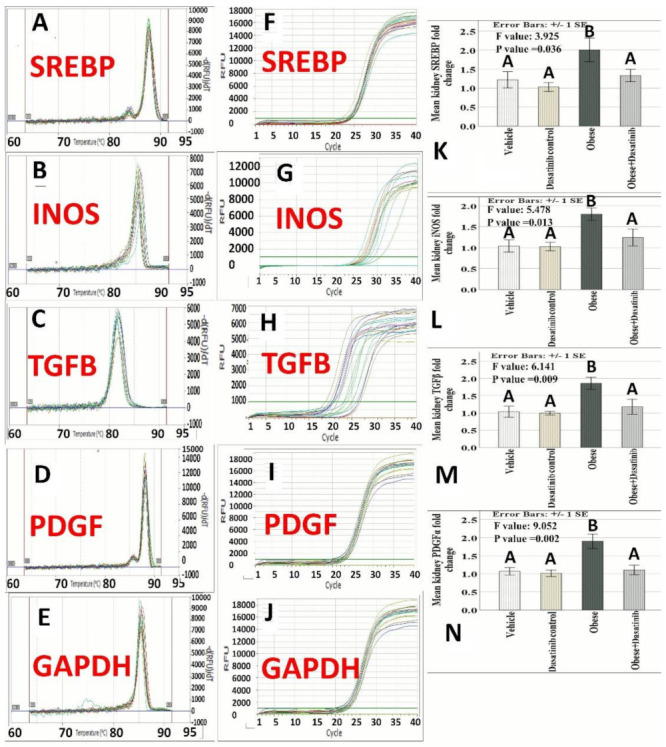
Figure 2.

Effect of Dasatinib on melting curves, amplification plotsand histograms of gene expression profiles of SREBP, iNOS, TGF-β, PDGFα and GAPDH genes as studied by qRT-PCR in the model of obeosogenic diet-induced renal damage in mice. (A–E): Melting curves of the studied genes showing single sharp peaks confirming primers specificity. (F–J): Amplification plots “Linear view” showing the threshold which was set above the baseline in the exponential portion of the plot to accurately determine the threshold cycle (Ct) of the studied genes. (K–N): Histograms of the studied genes expression showing the means ± standard errors (SE) of genes fold change. Data are mentioned as mean ± SE, different letters = significant difference. SREBP1: Sterol regulatory element binding protein; iNOS: Inducible nitric oxide synthase; TGF-β: Transforming growth factor beta; PDGFA: Platelet-derived growth factor alpha.
