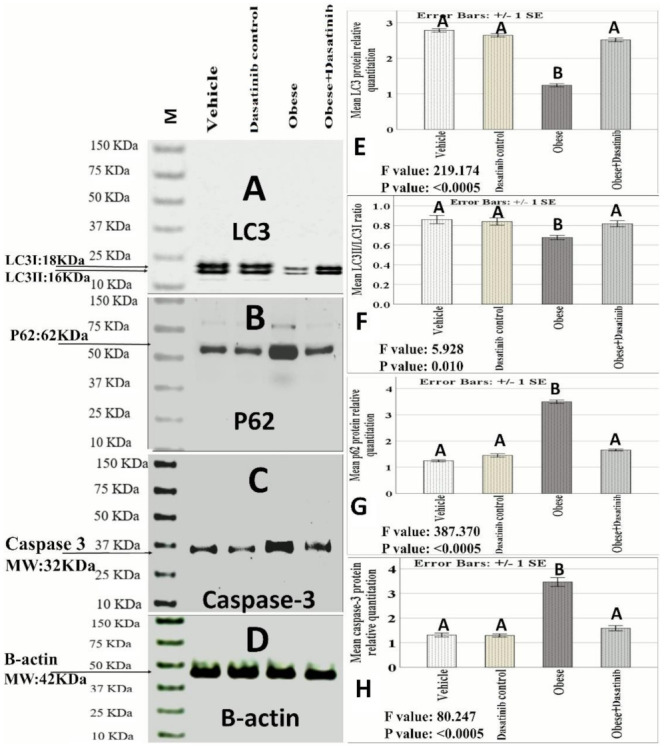
Figure 3.

(A–D) Protein analysis by Western blotting. (A) LC3 I and II (Molecular weight: 18 kDa and 16 kDa, respectively). (B) p62 (Molecular weight: 62 kDa). (C) Caspase-3: 32 kDa). (D) β-actin: 42 kDa). (E–H): LC3II, LC3II/LC3I ratio, P62 and caspase3 proteins relative quantitation /β-actin ratio) by Western blotting. Data are mentioned as mean ± SE; different letters = significant difference). LC3: Microtubule-associated proteins 1A/1B light chain 3B. M: Marker. MW: molecular weight.
