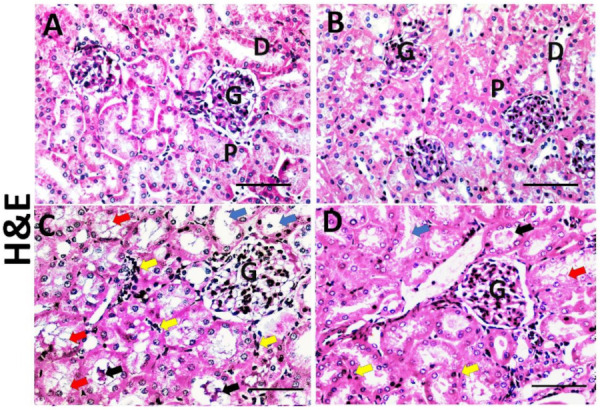
Figure 4.

Representative photographs of kidney histopathology; haematoxylin and eosin (×400) (A–D) in kidney tissues of vehicle, Dasatinib control, Obesogenic diet and Obesogenic diet + Dasatinib groups (A–D, respectively). ×400. Scale bar = 50 µm. Vehicle group and Dasatinib control group show normal kidney cortical architecture (A,B), normal glomeruli (G), proximal convoluted tubules (P) and distal convoluted tubules (D), while the Obesogenic diet group (C) showed distortion of kidney architecture, glomerular expansion (G), tubular vacuolation (red arrows), tubular dilation (blue arrows), cast formation (black arrows) and increased number of inflammatory cells (yellow arrows). However, Obesogenic diet + Dasatinib group (D) showed relative restoration of kidney architecture with mild glomerular expansion (G), less marked tubular vacuolation (red arrows), occasional tubular dilation (blue arrows), few cast formation (black arrows) and few number of inflammatory cells (yellow arrows).
