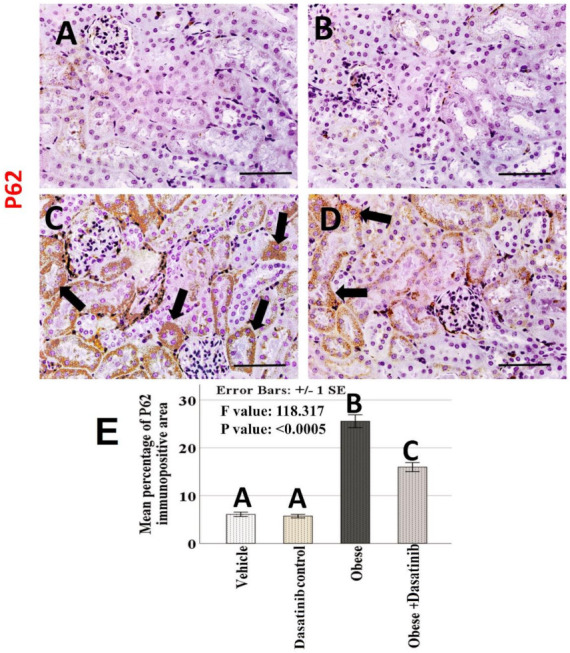
Figure 8.

(A–D): Light-microscopic image of renal tissue with P62 immunopositive staining (×400) in the kidney tissues of all experimental groups; vehicle, Dasatinib control, Obesogenic diet and Obesogenic diet + Dasatinib groups (A–D, respectively). Scale bar = 50 µm. (E) Morphometric analysis of the mean percentage of P62 immunopositive area. Results are mentioned as mean ± standard error. p value is presented as letters (different letters mean statistically significant difference). Arrows = P62 + ve cells.
