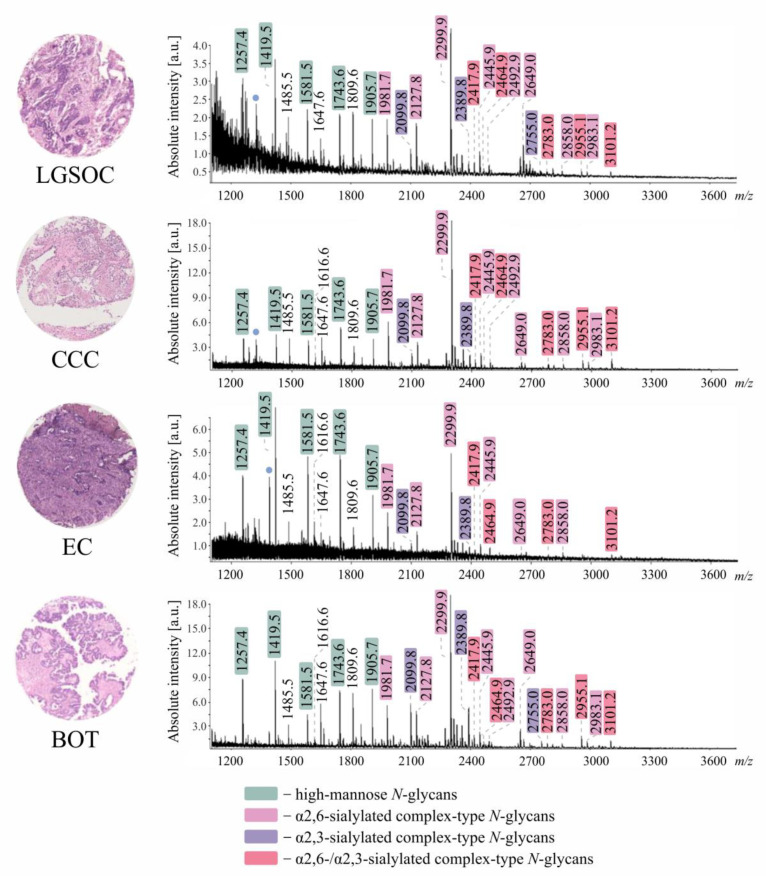
Figure 2.
Average [M+Na]+ MALDI imaging mass spectra of all investigated tissue specimens (LGSOC n = 4, CCC n = 6, EC n = 7, BOT n = 7). N-glycan compositions of indicated m/z species are shown in Table 1. For each TMA slide, only one representative tissue core is shown. Blue dots: non-carbohydrate contaminants.

