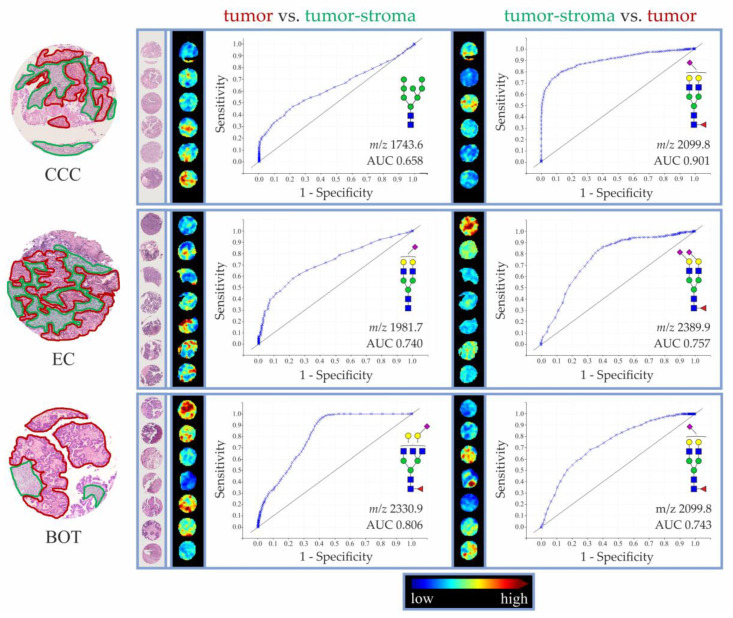
Figure 5.
ROC curves and MALDI-MSI pictures of the most discriminatory N-glycan structures as determined for tumor and tumor-stroma in CCC (n = 6), EC (n = 7), and BOT (n = 7) TMA specimens. Annotation of tissue regions is shown only for one representative core of each histotype. Tumor regions are marked in red, whereas tumor-stroma is marked in green.

