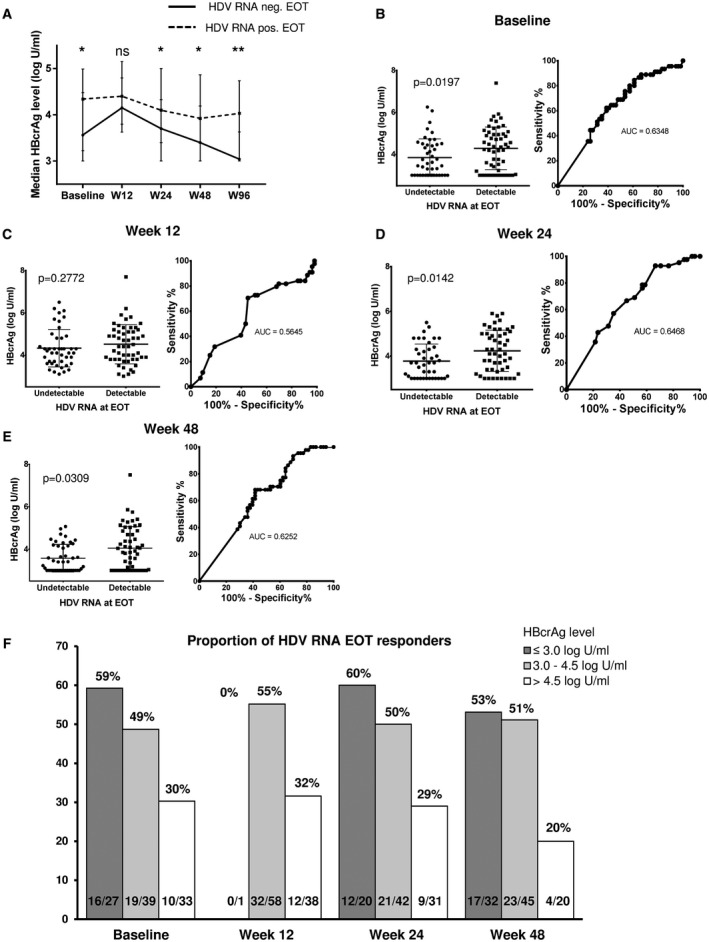
FIG. 3.

(A) Median HBcrAg levels (log U/mL) at different time points during treatment separated into responders at EOT (undetectable HDV RNA at w96; n = 45) and nonresponders at EOT (n = 54). Median HBcrAg levels and ROC curves at baseline (B), w12 (C), w24 (D), and w48 (E) for undetectable HDV RNA at EOT. (F) Proportions of EOT responders according to HBcrAg level at each time point. *P ≤ 0.05; **P ≤ 0.01. Abbreviations: AUC, area under the curve; ns, not significant.
