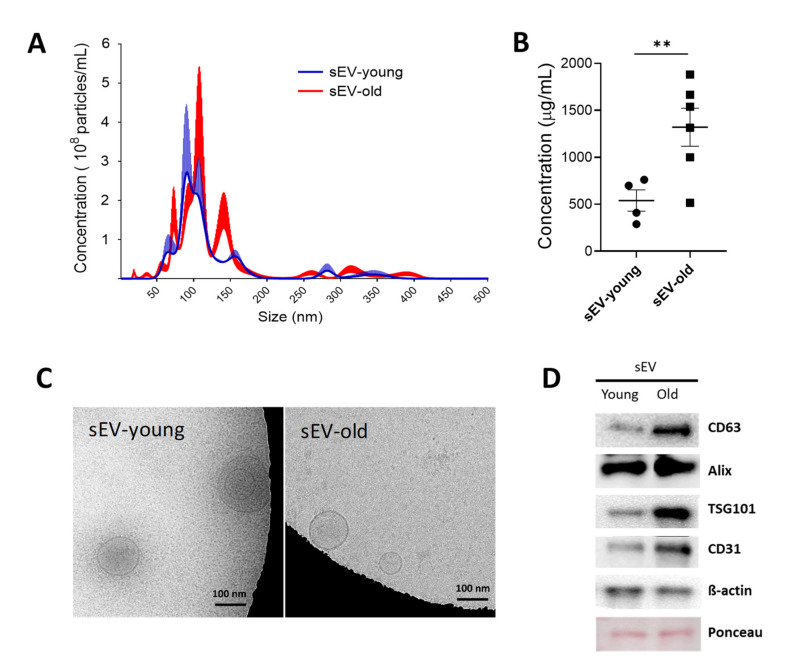
Figure 1.
Characterization of sEVs isolated from plasma of young (3-month-old) and old mice (24-month-old). sEVs were enriched by differential ultracentrifugation. (A) Nanoparticle-tracking analysis (NTA) of sEV fractions from young (blue line) and old (red line) mice blood plasma. The graph shows sEV concentration and size, mean ± SEM (n = 3). (B) Protein equivalents measured by microBCA. (C) Cryo-TEM on purified sEVs. (D) Western blotting for sEV- and endothelial-associated markers. ** p < 0.01 from unpaired t-test with Welch’s correction.

