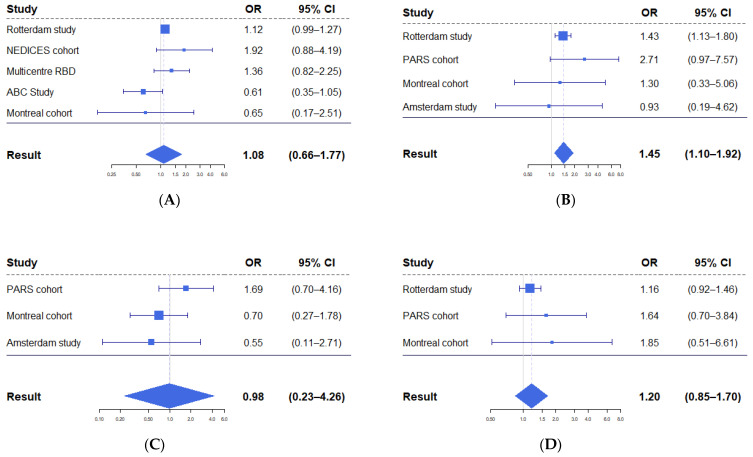
Figure 3.
Forest plots displaying results from meta-analyses of odds of conversion to PD per standard deviation of worse performance. (A) Meta-analysis of global cognition scores. (B) Meta-analysis of executive function scores. In both the Rotterdam and Montreal cohorts, multiple tests were used to assess executive functioning. (C) Meta-analysis of attention scores. (D) Meta-analysis of learning and memory scores.

