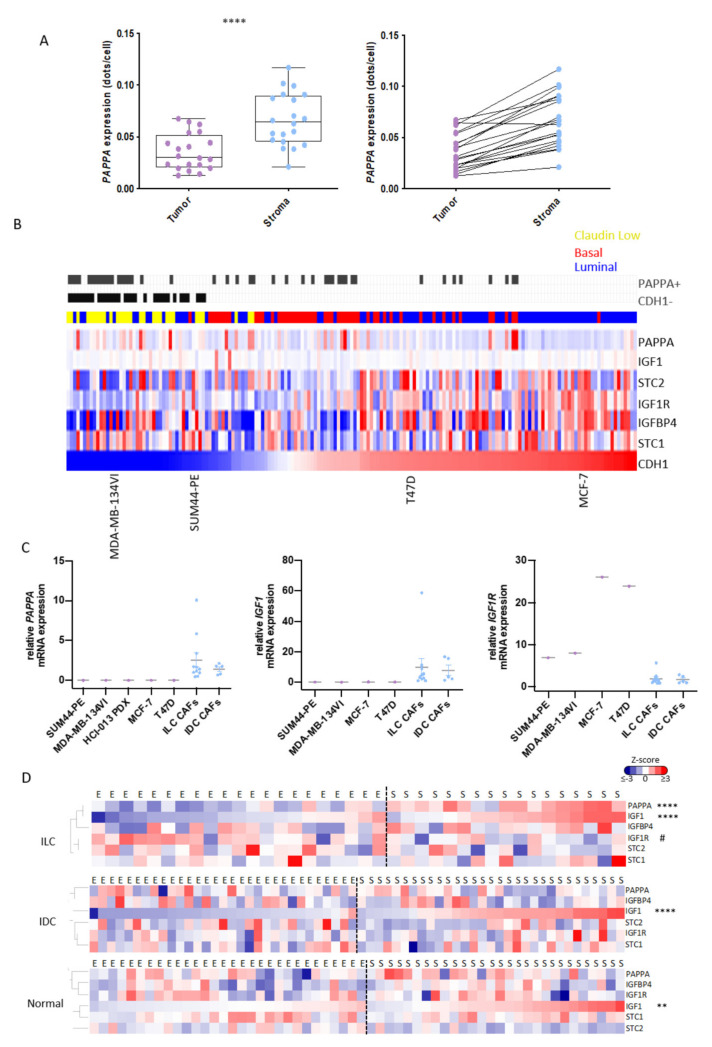
Figure 5.
PAPPA and IGF1 are predominantly expressed in the stroma of ILC. (A) RNAScope for PAPPA was performed in 20 ILC tumor samples that were used for generation of the LCM-ILC dataset. Samples were analyzed using QuPath with transcripts in both the stromal and epithelial compartments quantified. Left: Boxplots representing expression of PAPPA (dots per cell) in the tumor and stroma. Paired t-test, **** p < 0.0001. Right: Trend lines show an increase in PAPPA in the stroma of ILC samples compared to the tumor cells. Purple and blue dots represent data from tumor epithelium and stroma, respectively. (B) Heatmap representing the expression of PAPPA and associated genes across three integrated panels of breast cancer cell lines following batch correction, ranked by CDH1 expression. Blue, luminal; red, basal; yellow, claudin-low. Grey bars indicate samples where the detection call for PAPPA is assigned as ‘present’ and those tumors where CDH1 is ‘absent’. (C) Expression of PAPPA, IGF1 and IGF1R by qPCR in ILC human cell lines (purple dots) and primary CAFs (blue dots). Each sample was analyzed at three different passage numbers, and its average represented as the relative mRNA expression to ED30 primary ILC CAFs. Line represents the mean with SEM. (D) Heatmaps representing PAPPA and its regulators in the epithelial (E) and stromal (S) compartments of ILC-, IDC- (GSE68744) and normal- (GSE4823) LCM datasets. Heatmaps were generated from Z-scored values using Cluster 3.0 and TreeView. Adjusted p values were calculated using Wilcox test in R. ** p < 0.01, **** p < 0.0001, # p < 0.05. * Means up in stroma vs. epithelium, # means up in the epithelium vs. stroma.

