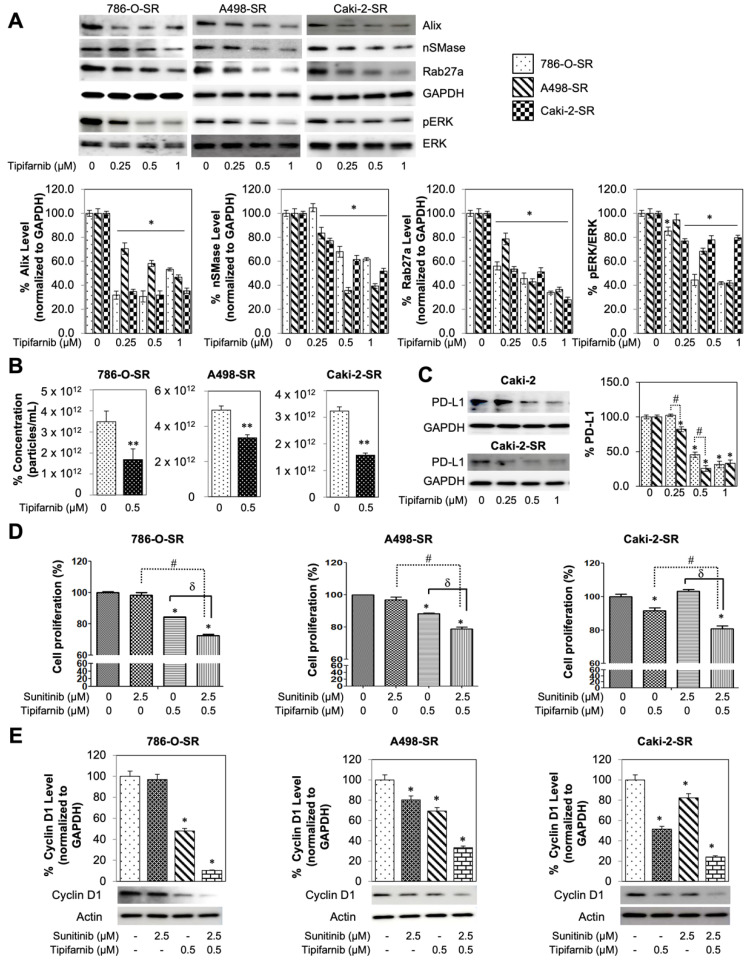
Figure 6.
Sunitinib resistant cells response to tipifarnib and combination treatment. (A) Effect of tipifarnib co-exposure on SR RCC cells. Both ESCRT-dependent and -independent pathways are inhibited by tipifarnib but reduce the protein expression of Alix, nSMase, and Rab27a in a dose-dependent manner. Decrease in exosome specific biogenesis and secretion markers were seen for 786-O-SR, A498-SR, and Caki-2-SR cells. Full blots are presented in Supplementary Figure S8. (B) qNano-IZON particle quantitative analysis (NP-100 nanopore) after tipifarnib treatment, depicting a significant decrease in exosome concentrations (50–250 nm size) in the CM of 786-O-SR, A498-SR, and Caki-2-SR cell lines. (C) PD-L1 levels decrease after tipifarnib treatment in both Caki-2 and Caki-2-SR cells. The densitometric plots show fold decrease in the expression of the signaling molecule. GAPDH immunoblot used as loading control was performed as previously described [21]. Full blots are presented in Supplementary Figure S8. (D) Anti-proliferative implications of the dual drug therapy on WST-8 assay. (E) Sunitinib and tipifarnib’s effect on cyclin D1 levels, normalized to GAPDH. Each assay throughout this figure was done in triplicate and the results were repeated at least in three independent batches of experiments. Representative results are shown, * p < 0.05, compared with the DMSO control groups, ** p < 0.01, compared with the DMSO control groups, # p < 0.01, compared with the sunitinib groups, and δ p < 0.01, compared with the tipifarnib groups. Full blots are presented in Supplementary Figure S7.

