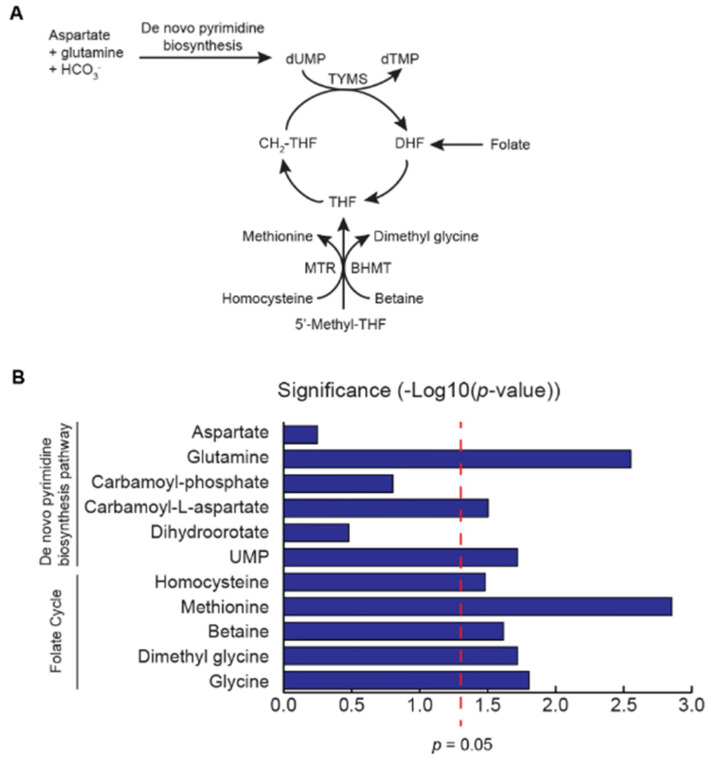
Figure 2.
Metabolomics analysis identifies upregulation of metabolites involved in de novo pyrimidine biosynthesis and downregulation of metabolites necessary to drive the folate cycle. (A). Diagram of the de novo pyrimidine biosynthesis pathway and the folate cycle. (B). Alterations in metabolites associated with folate cycle and de novo pyrimidine synthesis in AA tumors (n = 50) in a previously published metabolomics dataset (3). X-axis represents the degree of significance of altered metabolites in AA tumors vs benign adjacent tissue. Bars extending the right of the red dotted line indicates the statistical significance of the metabolic alterations (p ≤ 0.05). The Wilcoxon matched pairs signed rank test was used to calculate statistical significance.

