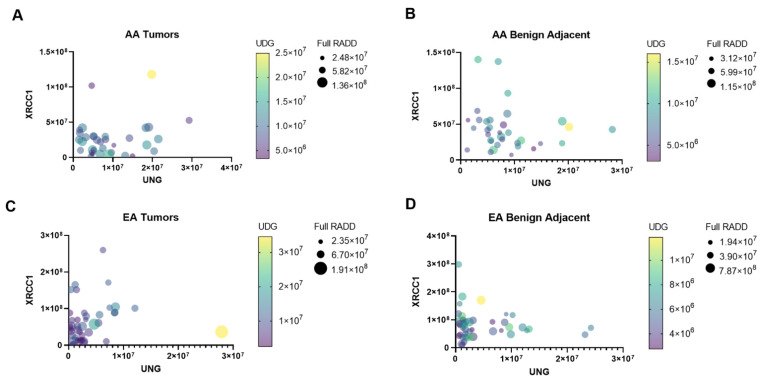
Figure 4.
DNA repair protein expression and damage profiles show unique signatures between AA and EA tumor and benign-adjacent samples. Multiple variable graphs of XRCC1 versus UNG expression in AA tumor (A), AA benign-adjacent (B), EA tumor (C), and EA benign-adjacent (D). The symbol color intensity corresponds to the uracil damage content (UDG RADD), while the symbol size reflects the overall DNA damage content (Full RADD).

