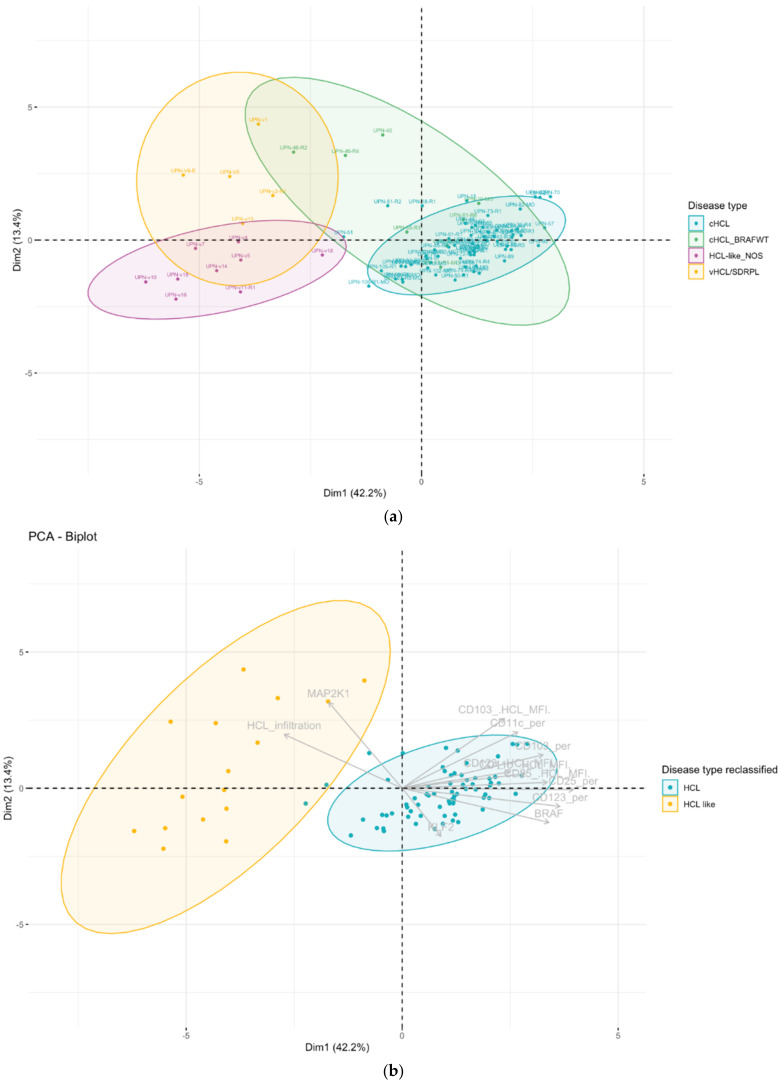
Figure 4.
(a) Samples colored according to the disease; (b) samples colored according to reclassification disease type. In gray are the variables. Ellipses represent confidence level for a concentration of 90%. Component principal analysis (CPA) projection (first versus second principal component). Each dot corresponds to a sample (cHCL n = 64, cHCL BRAFWT n = 8, vHCL/SDRPL n = 5, HCL-like NOS n = 9). Variables used: (percentage of expression + median of fluorescence of CD11c, CD103, CD123, CD25; percentage of abnormal cells on sample, BRAF, MAP2K1, KLF2 mutation status). Variable factors are shown in grey in the center. Ellipses represent confidence for a level concentration of 90%.

