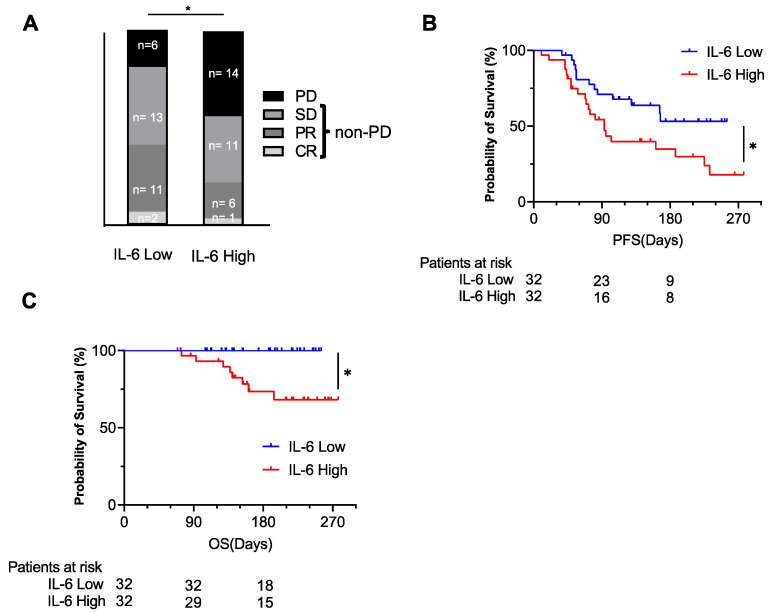
Figure 4.
The baseline plasma IL-6 level was examined by ELISA. The patients were divided into 2 groups by the median value of plasma IL-6. The best response to the treatment in each group (A) (* p < 0.05 by chi-squared test, PD vs. non-PD) and the Kaplan–Meier curves of PFS (B) and OS (C) for each group (* p < 0.05). CR, complete response; PR, partial response; SD, stable disease; PD, progressing disease; non-PD, non-progressive disease including complete response, partial response, and stable disease.

