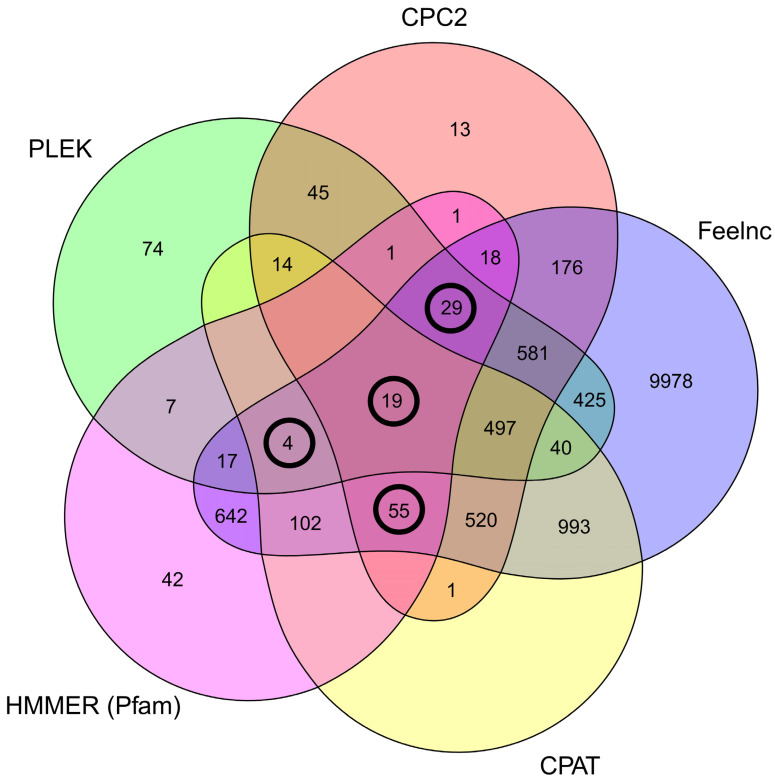
Figure 2.
Venn diagram visualizing the relationship between the number of transcripts classified as ‘non-coding’ by each program: CPAT, CPC2, Feelnc, PLEK and HMMER. Values in circles delimited the transcripts used during the subsequent steps of lncRNAs processing. Details are described in the text.

