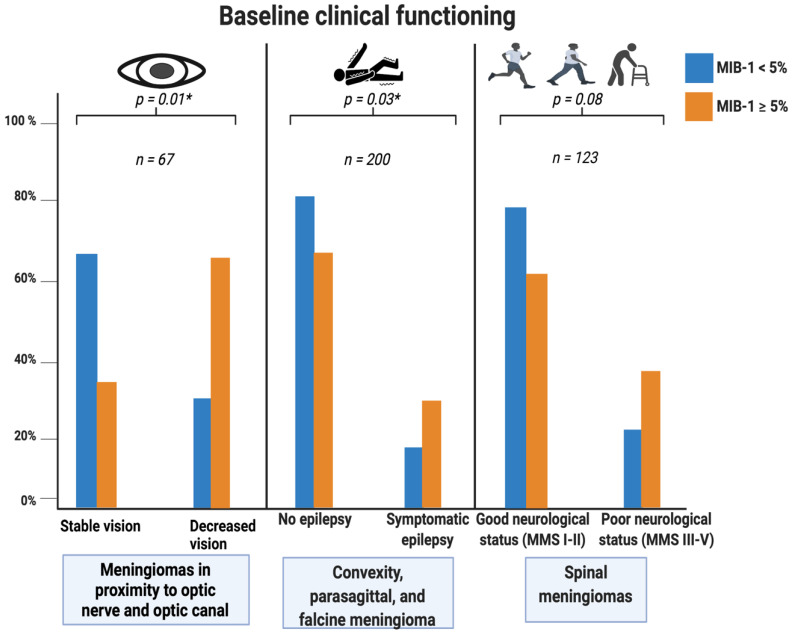
Figure 7.
Grouped bar charts with percentages. Relative frequency of specific clinical dysfunctions at presentation stratified by anatomical location. Portion of meningioma patients having an MIB-1 index <5% is displayed by the blue bars, whereas the orange bars represent meningioma patients with an MIB-1 index ≥5%. p-values of the Pearson’s chi-squared test (two-sided) are reported. Significant p-values are marked with an asterisk.

