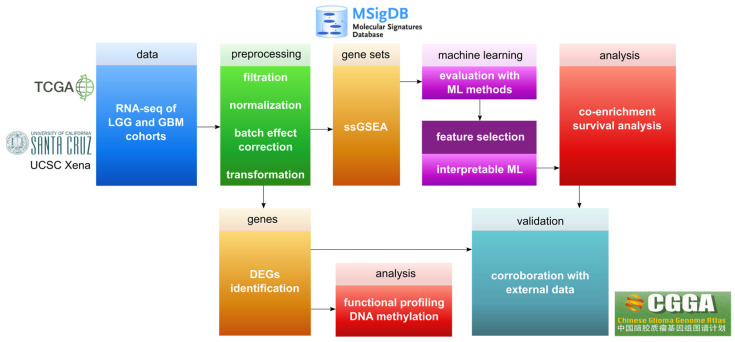
Figure 1.
Overview of the pipeline applied in this work. Following preprocessing were two separate analyses: The lower tier of the pipeline illustrates the steps employed for identification and basic analysis of DEGs, while the upper tier demonstrates the steps for ssGSEA analysis based on ML approaches using MSigDB collections. The final step illustrates the validation of the results.

