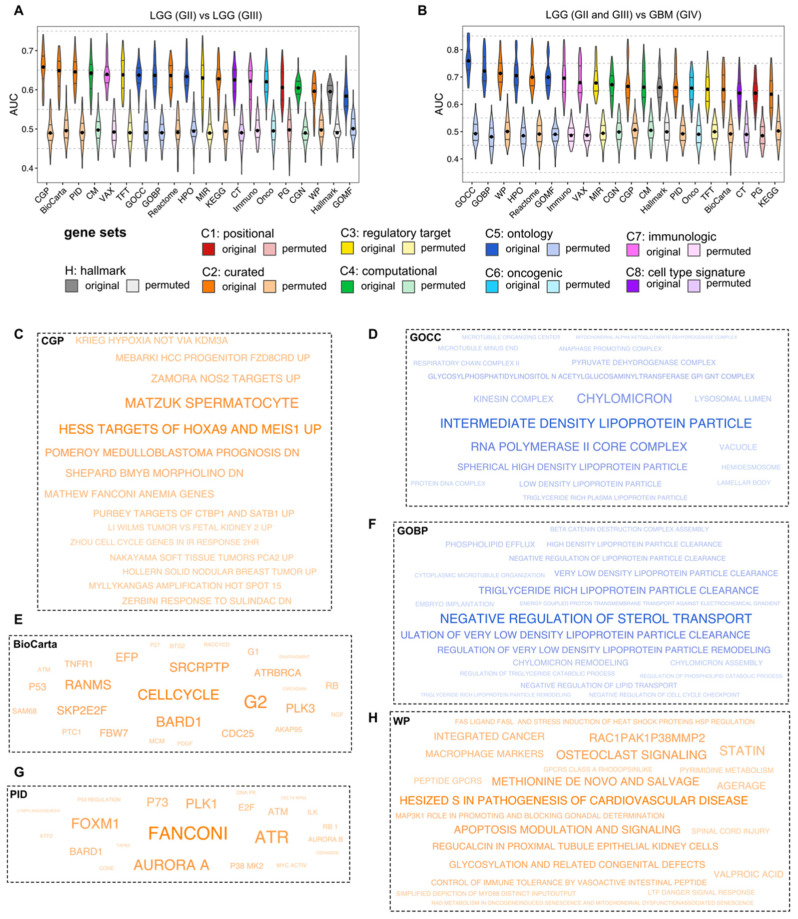
Figure 3.
(A,B) Evaluation of MSigDB collections using ML models with feature selection for discerning glioma grades using ssGSEA scores. Five different ML approaches were used: SMO, IBk, Bagging, J48 and JRip. Each ML method was undersampled 20-times with 10-fold CV. The median was marked with a black dot on each violin. Panels (C,E,G) represent MCFS results for the top three collections for GII vs. GIII. Size of annotations represents RI values from MCFS. Panels (D,F,H) represent MCFS results for the top three collections for GII vs. GIII. Size of annotations represents RI values from MCFS.

