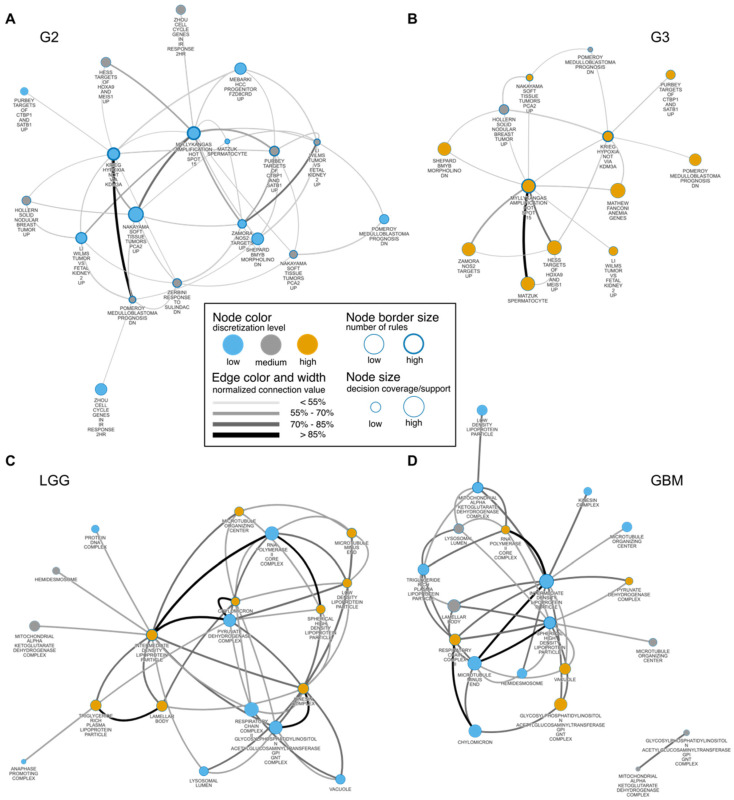
Figure 4.
Rule-based network displaying the most relevant co-enrichments of annotations obtained from (A,B) the CGP collection for the GII vs. GIII model (Table S7) and from (C,D) the GOCC collection for the LGG vs. GBM model (Table S8). The networks show the 20 most connected nodes obtained from the top 10% of significant rules (FDR-adjusted p-value < 0.01) based on the rule connection. Connection values of nodes and edges represent a strength of co-enrichment from the classifier. Subnetworks were generated separately with respect to the decision class for each RBM.

