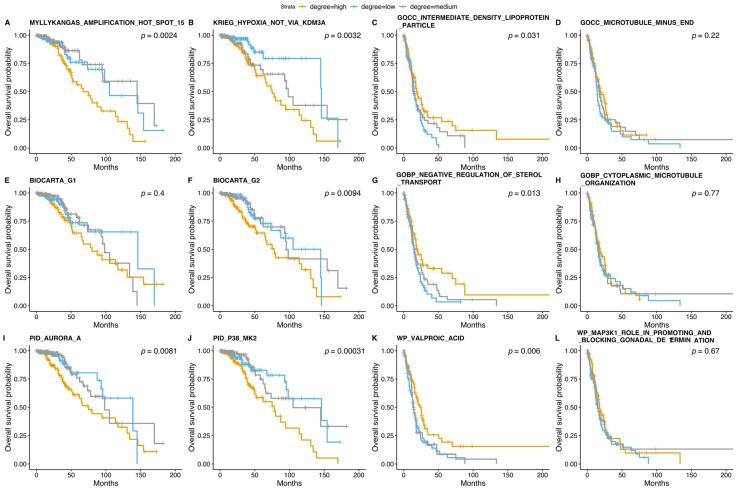
Figure 5.
Survival curves of several NOIs characterized based on rule networks. We investigated NOIs for the topmost predictive three MSigDB collections discerning glioma grades: (A–D) CGP and GOCC, (E–H) BioCarta and GOBP, and (I–L) PID and WP. Each plot displays a p-value that was estimated with the default set of parameters while constructing the curves (Table S1).

