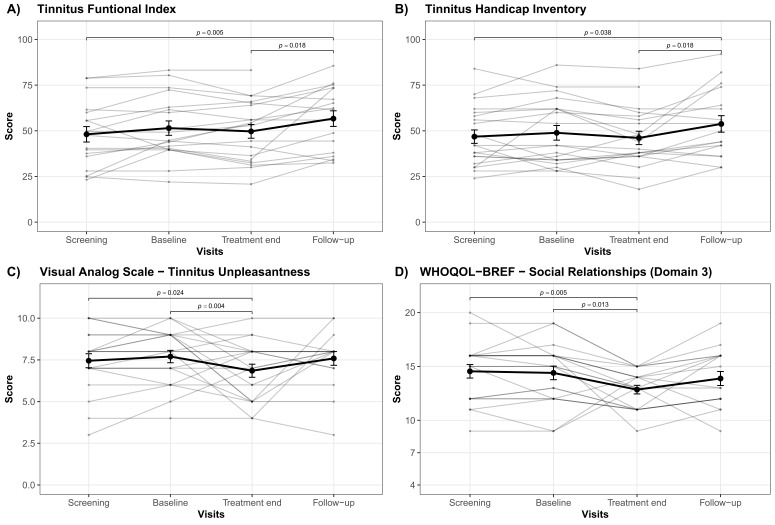
Figure 1.
Results of post hoc analysis. Averaged total score changes over the course of all study visits (screening, baseline, treatment end, follow-up) are presented by means of bold lines for the (A) Tinnitus Functional Index, (B) Tinnitus Handicap Inventory, (C) Visual Analog Scale for tinnitus unpleasantness and (D) the social relationship domain (domain 3) of the abbreviated version of the World Health Organization Quality of Life questionnaire. Error bars indicate standard errors. Significant differences between study visits are highlighted with bars and the respective p-values. Greyish lines represent the total scores on a single patient level.

